|
•
|
The time period when it is not known if the units in the row are functioning is indicated with a dashed line.
|
In the Fan.jmp sample data table there is a single Time column indicating failure time. When the failure time is unknown, the value Censored is recorded in the Censor column. All censored units are assumed to be right-censored. Event Plot for Right-Censored Data shows the Event Plot for this data.
Note: To construct the plot in Event Plot for Right-Censored Data, select Help > Sample Data Library and open Reliability/Fan.jmp. Click the green triangle next to the Life Distribution - Exponential script. Click the Event Plot disclosure icon.
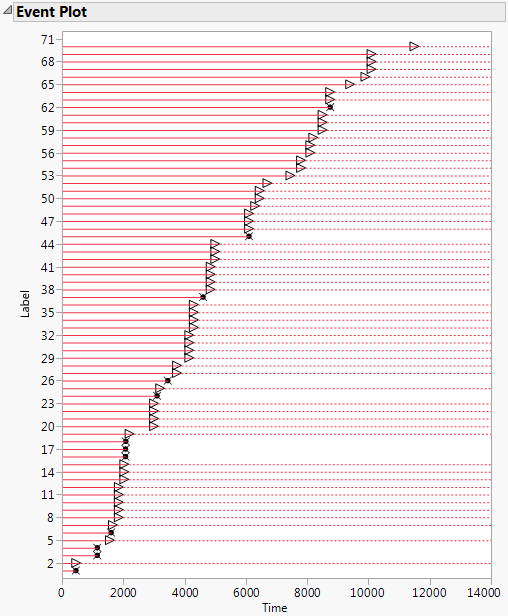
The unit in row 3 failed at Time 1150. Its lifetime is represented by a solid horizontal line that ends at Time 1150. The failure time is marked with an “x”.
The unit in row 5 is right censored. It was last know to be functioning at Time 1560. The time period during which the unit is known to be functioning is represented by a solid horizontal line that ends at Time 1560. At Time 1560, a right arrow is plotted. The line continues as a dashed line, indicating that the failure time is unknown, but greater than 1560.
In the Censor Labels.jmp sample data table, there are two columns, Start Time and End Time. Start Time indicates when units in a row were last known to be functioning. End Time indicates when units in that row were first known to have failed.
|
•
|
Units in rows 1 and 2 are left censored. They were known to fail before the time in the End Time column, but their exact failure times are unknown.
|
|
•
|
Units in rows 3 and 4 are right censored. They were known to be last functioning at the time in the Start Time column, but their failure times are unknown.
|
|
•
|
|
•
|
Units in rows 7 and 8 are not censored. Their failure times are given by the values in the Start Time and End Time columns, which are identical.
|
Event Plot for Mixed-Censored Data shows the Event Plot for this data.
Note: To construct the plot in Event Plot for Mixed-Censored Data, select Help > Sample Data Library and open Censor Labels.jmp. Click the green triangle next to the Life Distribution script.
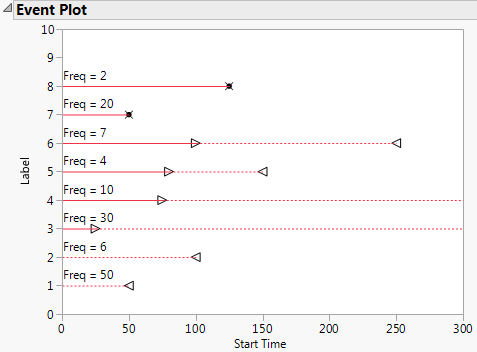
 indicates right censoring. The unit failed after its last inspection.
 indicates left censoring. The unit failed after being put on test and prior to the indicated time, but it is not known when it was last functioning.
|
•
|
 indicates that the unit failed during the time interval marked by the two arrow heads.
 indicates no censoring. The unit failed at the time marked by the x.