This example uses the Cars.jmp sample data table, which contains impact measurements of crash-test dummies in automobile safety tests. Compare these measurements for different automobile makes and models during the years 1990 and 1991.
|
1.
|
Filter the data to show only the years 1990 and 1991 and create a subset of the Cars.jmp data table.
|
2.
|
Select Rows > Data Filter.
|
|
3.
|
Select Year.
|
|
4.
|
Click Add.
|
|
6.
|
In the data table, select Tables > Subset.
|
|
7.
|
|
1.
|
Select Graph > Treemap.
|
|
2.
|
|
3.
|
|
4.
|
L Leg represents a measurement of injuries resulting from the deceleration speed of the left leg, where more deceleration causes more injury.
|
5.
|
Click OK.
|
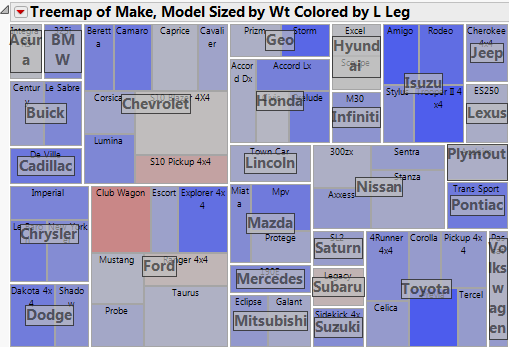
From Left Leg Deceleration Injuries, you can see that the Club Wagon and S10 Pickup 4x4 have the largest number of left leg deceleration injuries.
|
1.
|
From the red triangle menu, select Change Color Column.
|
|
2.
|
Select Head IC.
|
|
3.
|
Click OK.
|
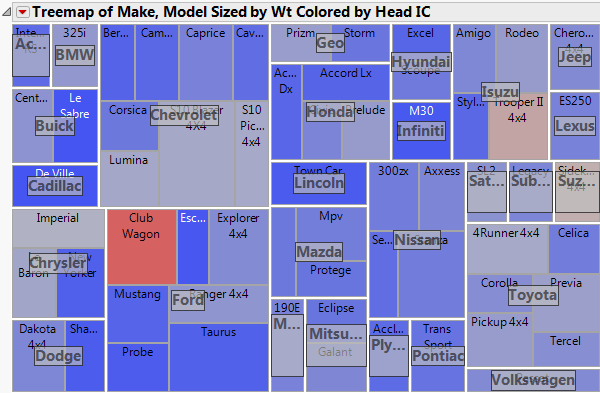
From Head Injuries, you notice the following: