The data are given in the TurbineEngineDesign1.jmp sample data table, found in the Reliability subfolder. For each failure that occurred, the number of days since test initiation was recorded in the column Day. The number of failures on a given day, or equivalently, the number of required fixes, was recorded in the column Fixes.
|
1.
|
|
2.
|
Select Analyze > Reliability and Survival > Reliability Growth.
|
|
3.
|
|
4.
|
|
5.
|
|
6.
|
Click OK.
|
The Reliability Growth report appears (Observed Data Report). The Cumulative Events plot shows the cumulative number of failures by day. Vertical dashed blue lines show the two transitions between the three phases.
|
7.
|
Click the Mean Time Between Failures disclosure icon.
|
This provides a plot with horizontal lines at the mean times between failures computed over intervals of a predetermined size (Mean Time between Failures Plot). An option in the red triangle menu enables you to specify the interval size.
|
8.
|
Click the Duane Plot disclosure icon.
|
This provides a plot that displays the Cumulative MTBF estimates on the Y axis versus the time to event variable on the X axis. If the data follow the Duane model, the points should fall along a line when plotted on log-log paper (Duane Plot).
|
9.
|
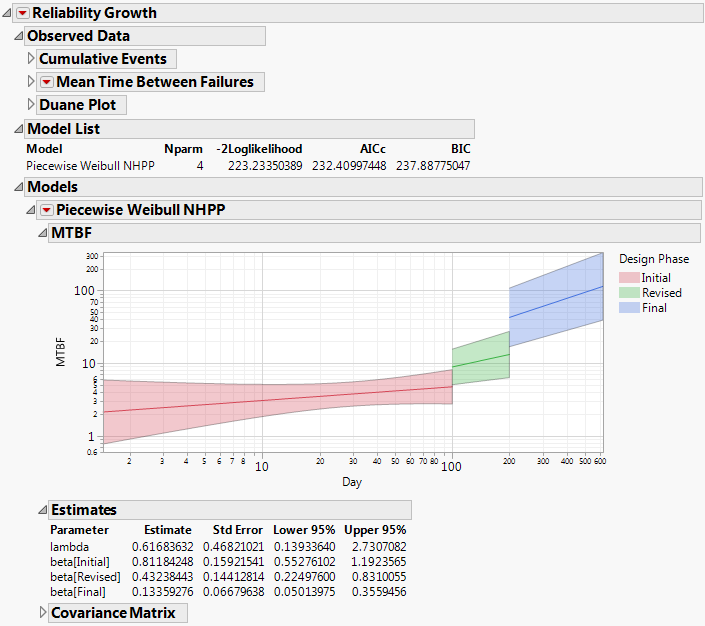
This fits Weibull NHPP models to the three phases of the testing program, treating these phases as multiple stages of a single reliability growth program. (See Piecewise Weibull NHPP Report.) Options in the Piecewise Weibull NHPP red triangle menu provide various other plots and reports.