This example uses the AdverseR.jmp sample data table, which contains adverse reactions from a clinical trial. Use this data to explore the conditional association of adverse events and then the relative risk of the events in the treatment group as compared to the control.
|
1.
|
|
2.
|
|
3.
|
|
4.
|
|
5.
|
|
6.
|
|
7.
|
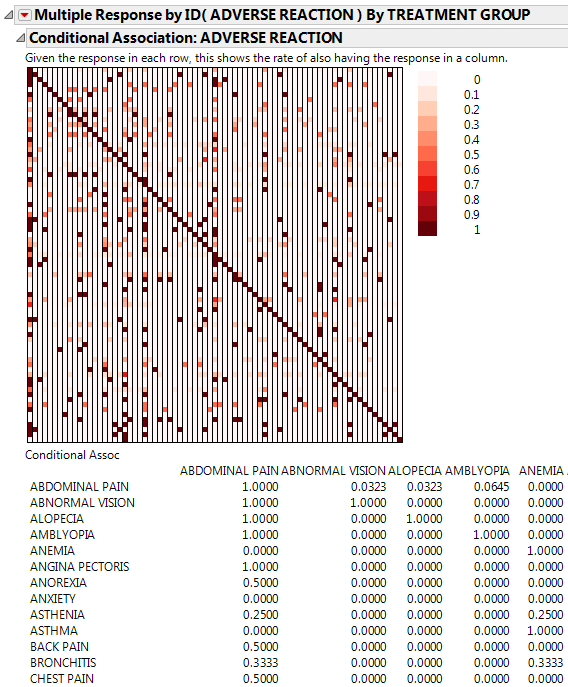
Click the Categorical red triangle menu and select Conditional Association.
|
|
8.
|
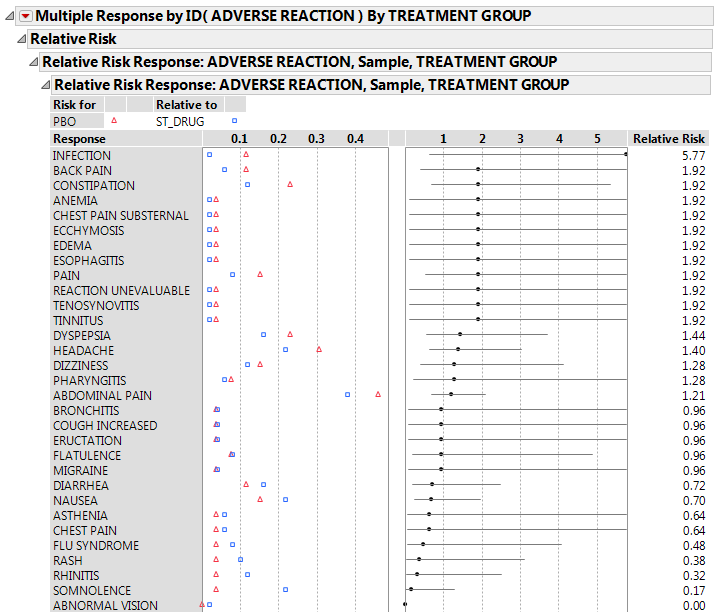
Click the Categorical red triangle menu and select Relative Risk.
|
|
9.
|
|
10.
|
Right-click the Relative Risk Report in the window and select Sort by Column.
|
|
11.
|
Right-click and select Columns > Lower 95% and Columns > Upper 95% to add 95% confidence intervals on the relative risk estimates to the report table.