|
1.
|
|
2.
|
Select Graph > Graph Builder.
|
|
3.
|
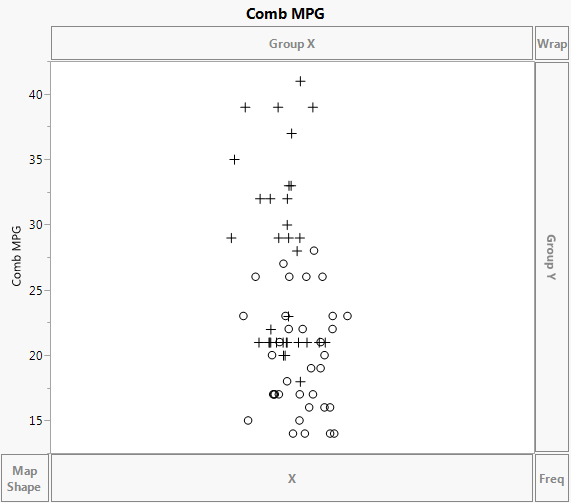
Because markers are assigned to rows in the data table, points are represented by those markers. The value of Comb MPG for each row is plotted at its value on the vertical axis. To avoid over-plotting points that correspond to observations with the same Comb MPG values, JMP randomly jitters the points.
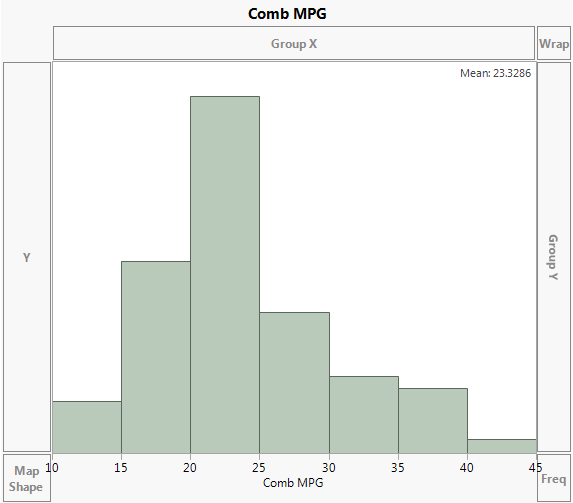
You want the histogram to be vertical, so you need to move Comb MPG to the X zone.
|
5.
|
Hover your cursor over Comb MPG in the Y axis. The cursor turns into a hand. Select and drag Comb MPG into the X zone.
|
|
1.
|
Click Start Over.
|
|
2.
|
|
4.
|
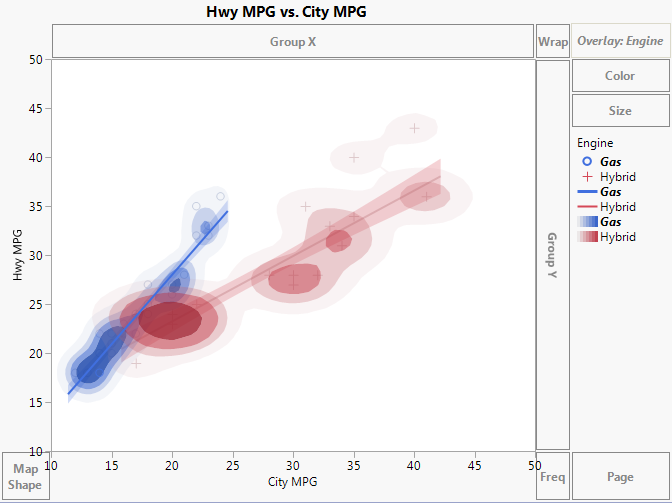
Drag Engine to the Group X zone.
|
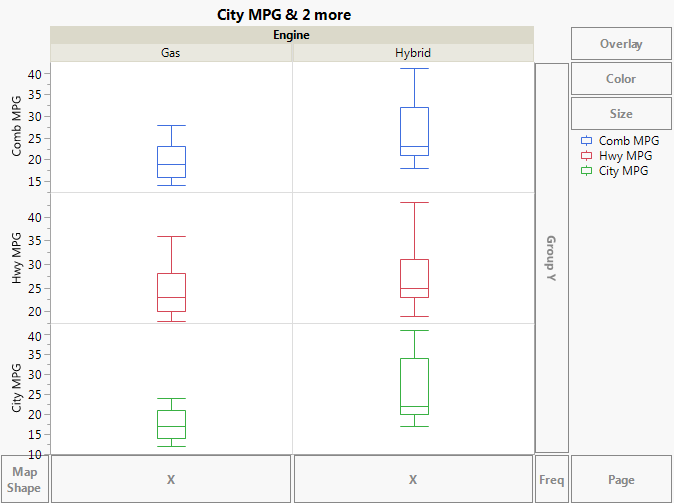
The boxplots show the distributions in a very compact form. You can see that all three types of MPG values are substantially lower for the gas vehicles than for the hybrids in the study. From the horizontal lines in the centers of the two City MPG boxplots, you can estimate that the median difference is about five miles per gallon. However, you can use the Caption element to be sure.
|
7.
|
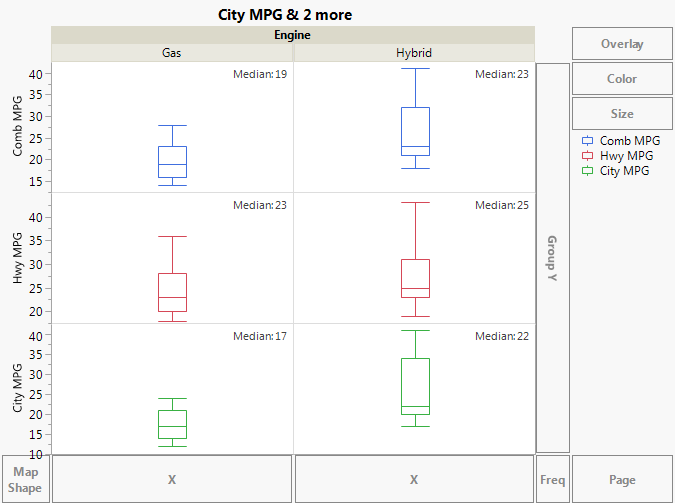
In the Caption Box options at the left of the plot, select Median from the Summary Statistic list for Comb MPG, Hwy MPG, and City MPG.
|
|
1.
|
Click Start Over.
|
|
2.
|
|
3.
|
|
4.
|
|
6.
|
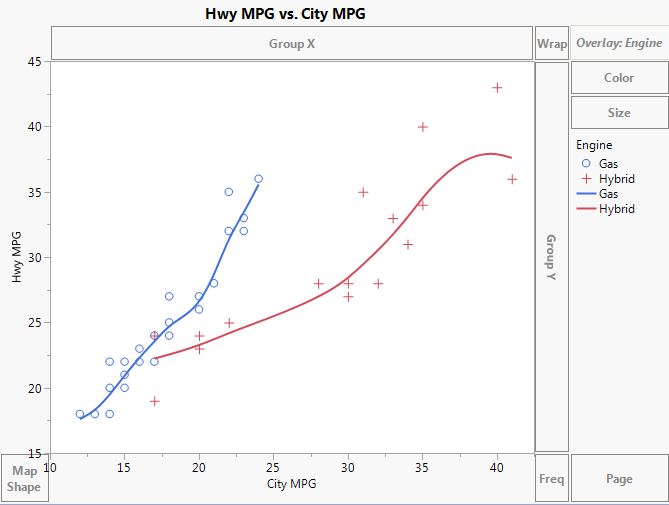
Drag a rectangle around the “o” marker with the smallest value of City MPG and check the number of rows selected in the Rows panel of the data table.
|