|
1.
|
|
2.
|
In the Health Risk Survey data table, click the green triangle next to the Launch LCA Platform script.
|
|
3.
|
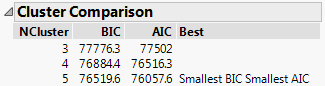
Type 5 in the box next to Up to.
|
|
4.
|
Click OK.
|
|
6.
|
|
7.
|
Click OK.
|
|
8.
|
Click OK in the JMP Alert that appears.
|
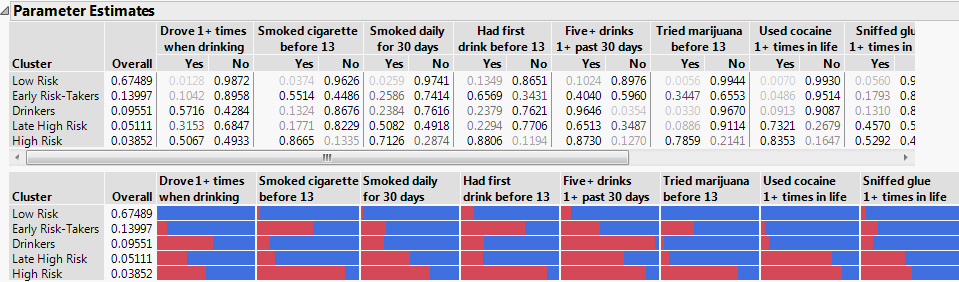
Partial Parameter Estimates Report shows parameter estimates for the first 8 variables in the analysis. The new cluster names appear in the report window.
|
9.
|
Click the red triangle next to Latent Class Model for 5 Clusters and select Save Mixture and Cluster Formulas.
|
|
10.
|
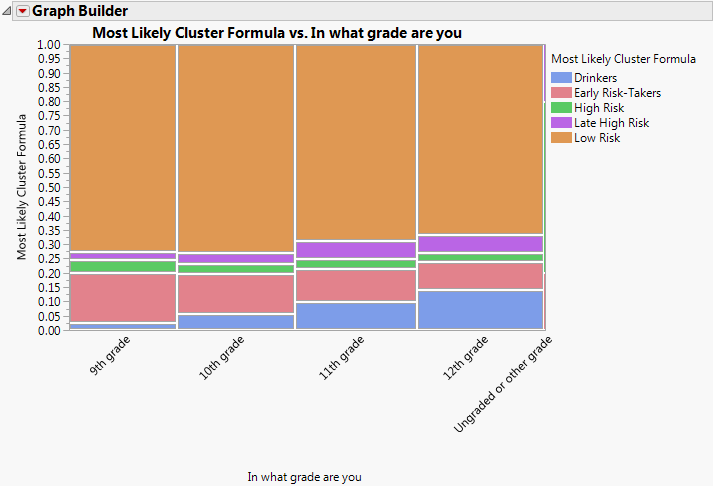
Select Graph > Graph Builder.
|
|
11.
|
|
12.
|
|
14.
|
Click Done.
|