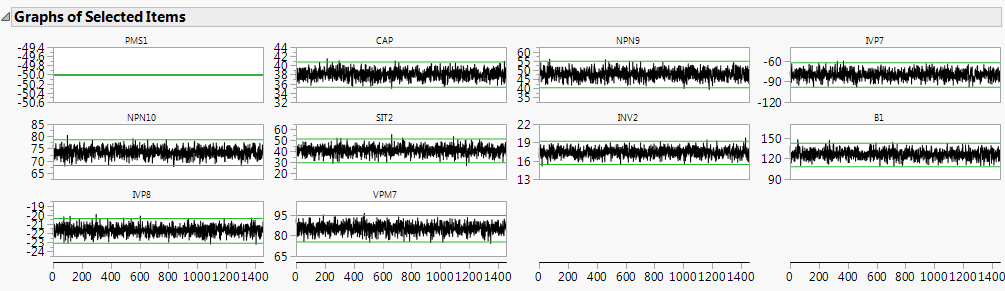
The Semiconductor Capability.jmp sample data table contains 128 columns of process measurements. Each column contains 1,455 measurements. You are interested in which of the processes are unstable. Also, each column contains a Spec Limits column property. If a process is stable, it is appropriate to calculate its process capability. You proceed to assess both stability and capability for this data table.
|
1.
|
|
2.
|
Select Analyze > Screening > Process Screening.
|
|
3.
|
|
4.
|
Click OK.
|

|
5.
|
|
6.
|
Click the red triangle next to Process Screening and select Quick Graph for Selected Items.
|
|
8.
|
Click the red triangle next to Process Screening and select Control Charts for Selected Items.
|
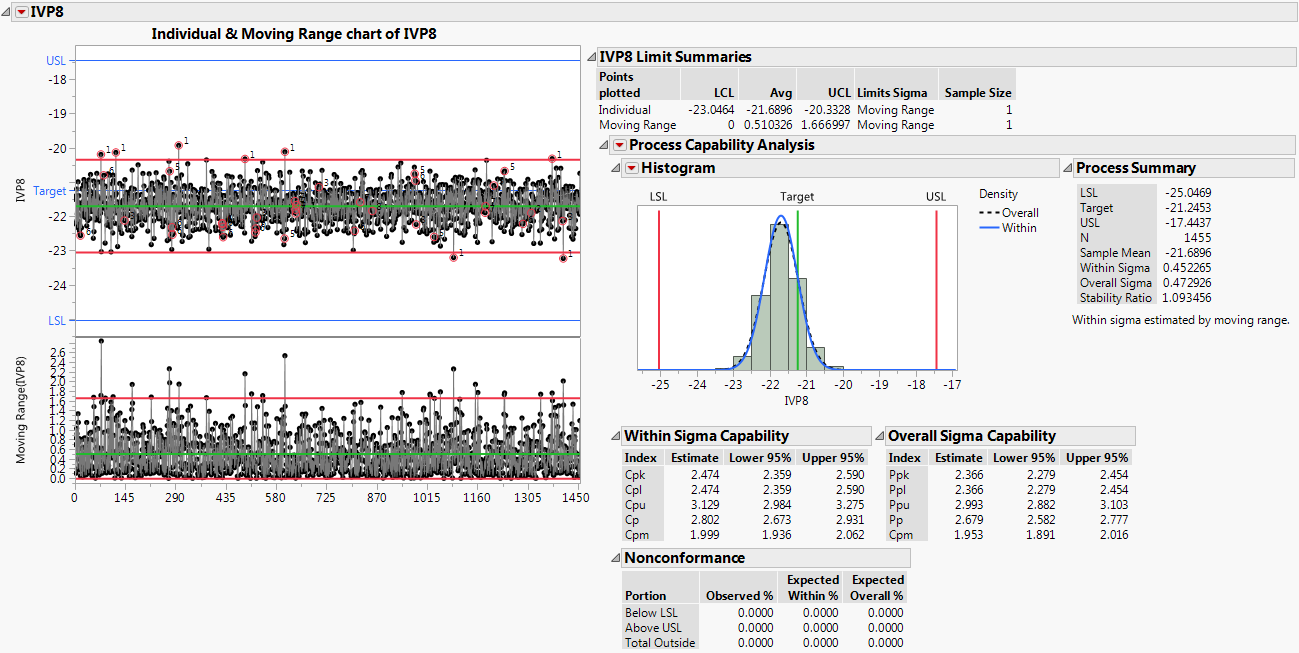
A Control Chart Builder report appears. Because IVP8 has a Spec Limits column property, the report also includes a capability analysis.