|
1.
|
|
2.
|
|
3.
|
|
4.
|
Click OK.
|
|
–
|
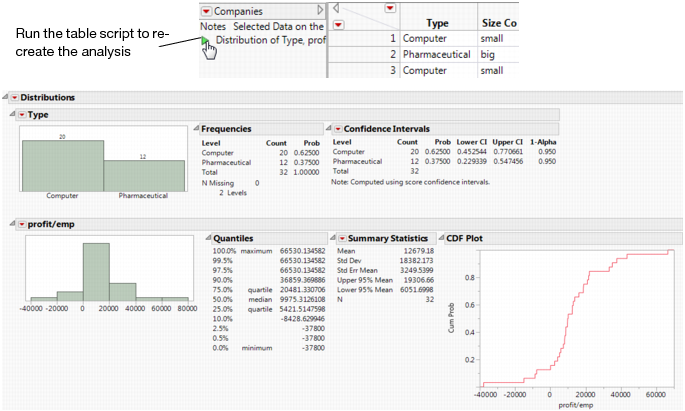
Histogram Options > Show Counts
|
|
–
|
Confidence Interval > 0.95
|
|
–
|
Outlier Box Plot, to remove the outlier box plot
|
|
–
|
|
1.
|
To save this analysis, select Save Script > To Data Table from the red triangle menu for Distributions. The new script appears in the Table panel.
|