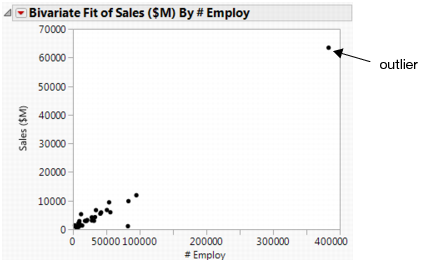
This example uses the Companies.jmp sample data table, which contains financial data for 32 companies from the pharmaceutical and computer industries.
|
1.
|
|
2.
|
|
3.
|
|
4.
|
|
5.
|
Click OK.
|
|
6.
|
|
8.
|
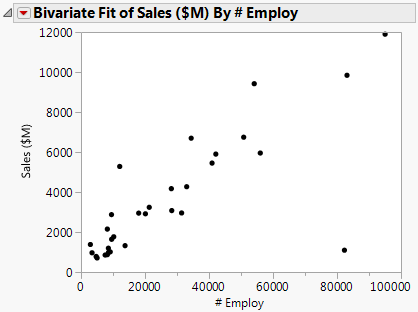
Select Rows > Exclude/Unexclude. The point is excluded from the analysis and the scatterplot is automatically updated.
|
|
9.
|
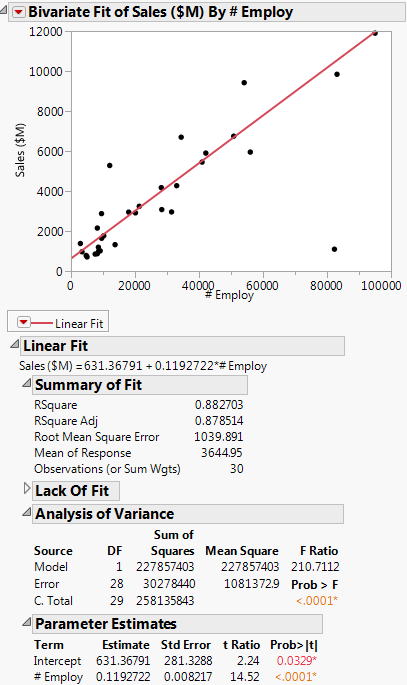
Fit a regression line by selecting Fit Line from the red triangle menu. Regression Line and Analysis Results shows the regression line and analysis results added to the report window.
|
|
11.
|
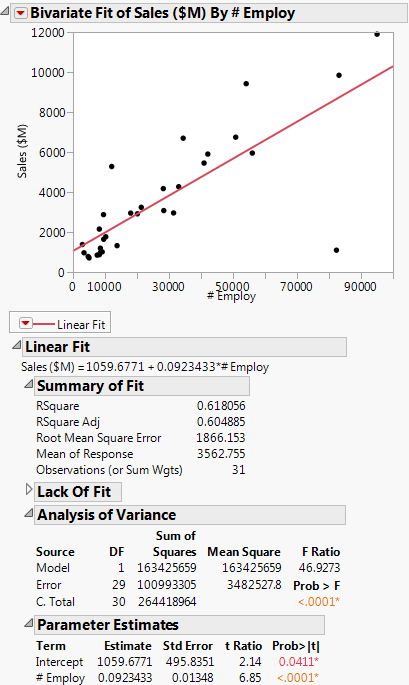
Select Rows > Exclude/Unexclude. The regression line and analysis results are automatically updated, reflecting the exclusion of the point.
|
Tip: When you exclude a point, the analyses are recalculated without the data point, but the data point is not hidden in the scatterplot. To also hide the point in the scatterplot, select the point, and then select Rows > Hide and Exclude.