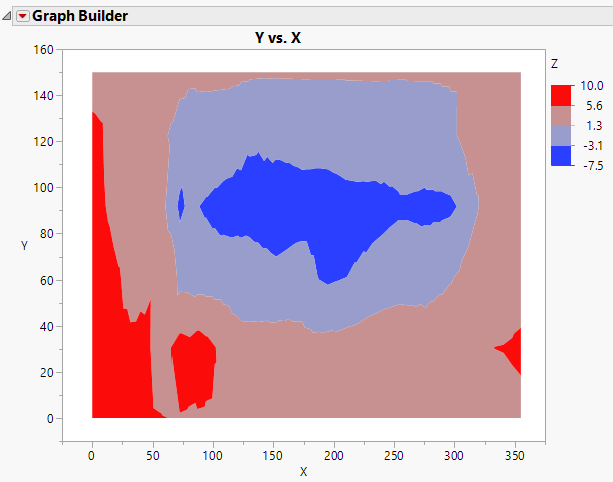
1.
Select Help > Sample Data Library and open Little Pond.jmp.
2.
Select Graph > Graph Builder.
3.
Click and drag the X coordinate to the X zone.
4.
Click and drag the Y coordinate to the Y zone.
5.
Click and drag depth, Z, to the Color zone.
Contour Plot in Graph Builder

Help created on 9/19/2017