|
1.
|
Select DOE > Classical > Taguchi Arrays.
|
|
2.
|
|
4.
|
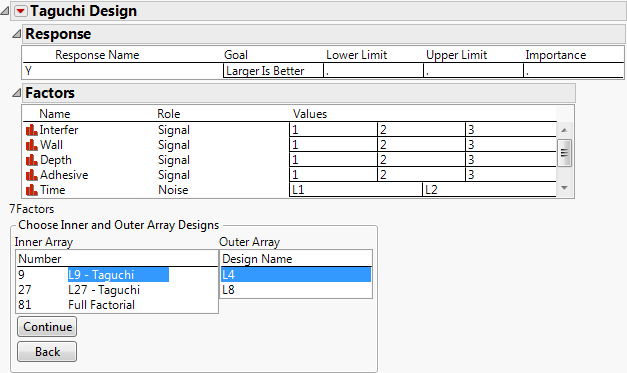
Ensure that L9-Taguchi is selected to give the L9 orthogonal array for the inner design.
|
|
5.
|
Click L8 to give an eight-run outer array design.
|
|
6.
|
Click Continue.
|
|
7.
|
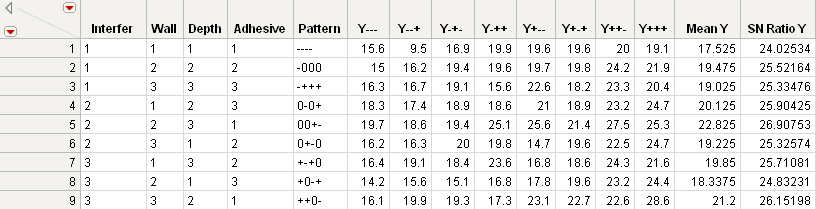
Now, suppose the pull-off adhesive force measures are collected and entered into the columns containing missing data, as shown in Complete Taguchi Design Table (Byrne Taguchi Data.jmp). The missing data column names are appended with the letter Y before the levels (+ or –) of the noise factors for that run. For example, Y--- is the column of measurements taken with the three noise factors set at their low levels.
|
8.
|
Select Help > Sample Data Library and openDesign Experiment/Byrne Taguchi Data.jmp. Complete Taguchi Design Table (Byrne Taguchi Data.jmp) shows the completed design.
|
The column named SN Ratio Y is the performance statistic computed with the formula shown below. In this case, it is the “larger-the-better” (LTB) formula, which is –10 times the common logarithm of the average squared reciprocal:
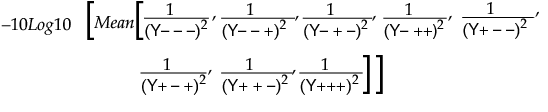
This expression is large when all of the individual y values are large.
|
1.
|
In the Byrne Taguchi Data.jmp data table, click the green arrow to run the Model script.
|
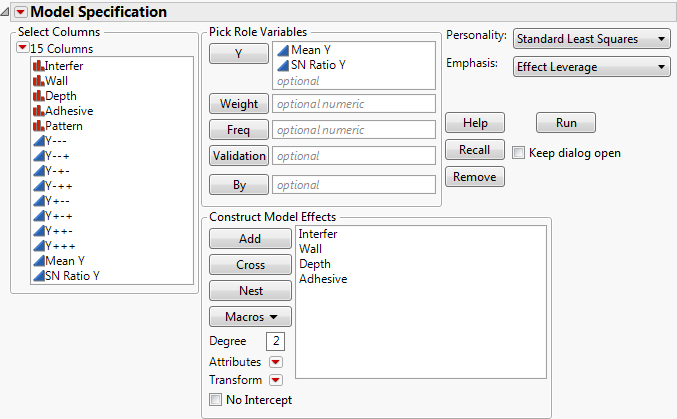
The Fit Model window automatically has the appropriate effects. It includes the main effects of the four signal factors. The two responses are the mean (Mean Y) and signal-to-noise ratio (SN Ratio Y) over the outer array.
|
2.
|
Click Run.
|
|
3.
|
From the Response Mean Y red triangle menu, select Factor Profiling > Profiler.
|
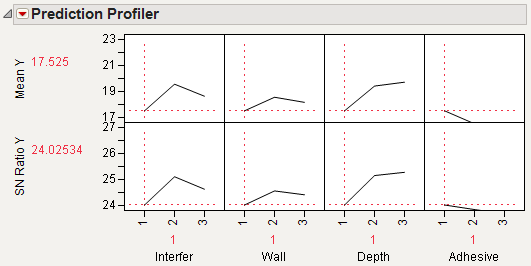
The profile traces (The Prediction Profiler) indicate that different settings of the first three factors would increase SN Ratio Y. Find the optimal settings.
|
4.
|
From the Prediction Profiler red triangle menu, select Optimization and Desirability > Desirability Functions.
|
This adds the row of traces and a column of function settings to the profiler, as shown in Best Factor Settings for Byrne Taguchi Data. The default desirability functions are set to larger-is-better, which is what you want in this experiment. See Profiler in the Profilers book for more details about the prediction profiler.
|
5.
|
From the Prediction Profiler red triangle menu, select Optimization and Desirability > Maximize Desirability.
|
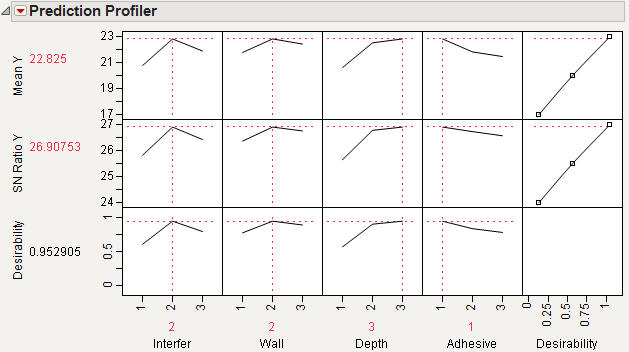
In this example, the settings for Interfer and Wall changed from 1 to 2. (See The Prediction Profiler and Best Factor Settings for Byrne Taguchi Data). The Depth setting changed from 1 to 3. The settings for Adhesive did not change. These new settings increased the signal-to-noise ratio from 24.0253 to 26.9075.