This example uses the Tiretread.jmp sample data table. There are three factors (SILICA, SILANE, and SULFUR) and four responses (ABRASION, MODULUS, ELONG, and HARDNESS). This data table already contains saved prediction formula columns for the four response variables.
|
1.
|
|
2.
|
Select Graph > Contour Profiler.
|
|
3.
|
Select Pred Formula ABRASION, Pred Formula MODULUS, Pred Formula ELONG, and Pred Formula HARDNESS and click Y, Prediction Formula.
|
|
4.
|
Click OK.
|
The values for SILICA are on the horizontal axis and the values for SILANE are on the vertical axis. The value for SULFUR is fixed at 2.25. See Contour Profiler.
|
5.
|
|
6.
|
|
7.
|
Contour Profiler for Tiretread.jmp
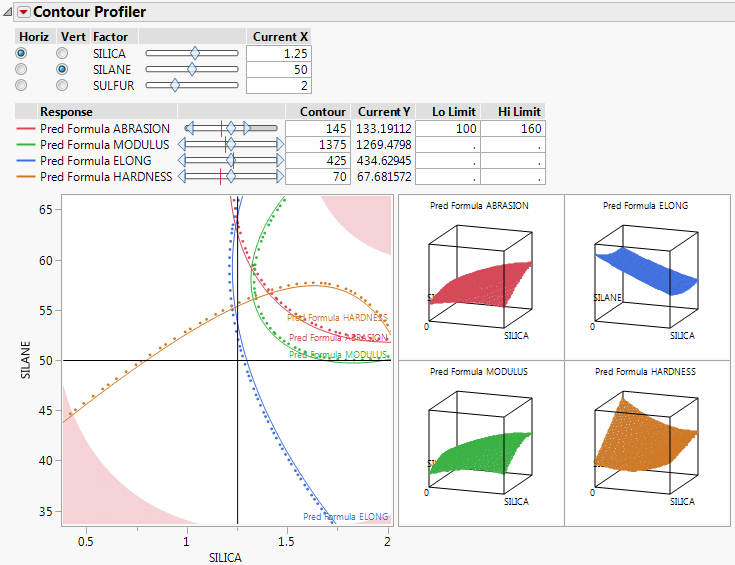
The contour lines and surface plots differ from those in Contour Profiler because SULFUR is set at a different value. Move the slider bar for SULFUR to see how different values further change the contour lines and surface plots. The shaded area on the contour plot represents the region of the graph that is not feasible, based on the Lo Limit and Hi Limit values for ABRASION,