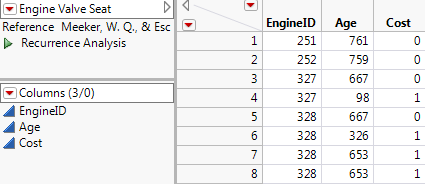
A typical unit might be a system, such as a component of an engine or appliance. For example, consider the sample data table Engine Valve Seat.jmp, which records valve seat replacements in locomotive engines. See Meeker and Escobar (1998, p. 395) and Nelson (2003). A partial listing of this data is shown in Partial Engine Valve Seat Data Table. The EngineID column identifies a specific locomotive unit. Age is time in days from beginning of service to replacement of the engine valve seat. Note that an engine can have multiple rows with its age at each replacement and its cost, corresponding to multiple repairs. Here, Cost=0 indicates the last observed age of a locomotive.
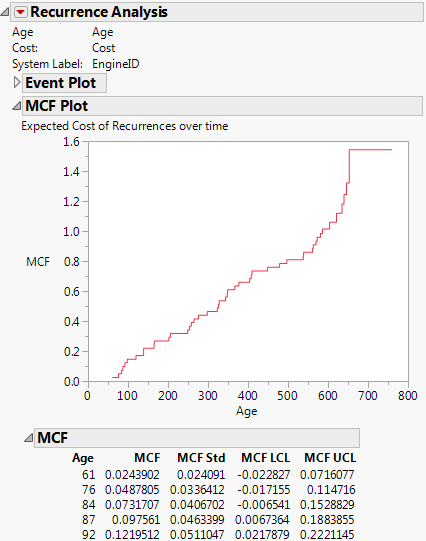
When you click OK, the Recurrence platform shows the reports in MCF Plot and Partial Table for Recurrence Analysis and Event Plot for Valve Seat Replacements. The MCF plot shows the sample mean cumulative function. For each age, this is the nonparametric estimate of the mean cumulative cost or number of events per unit. This function goes up as the units get older and total costs grow. The plot in MCF Plot and Partial Table for Recurrence Analysis shows that about 580 days is the age that averages one repair event.
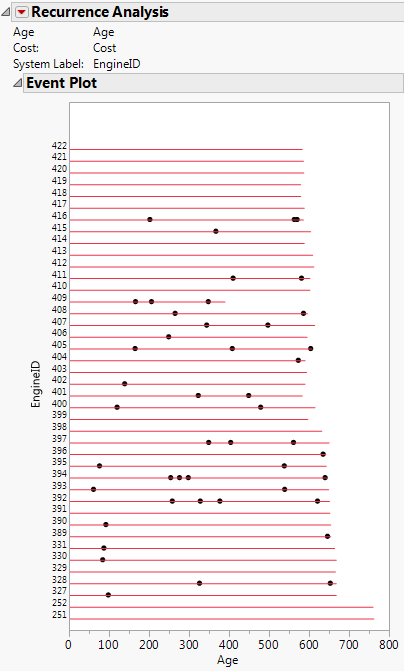
The event plot in Event Plot for Valve Seat Replacements shows a time line for each unit. There are markers at each time of repair, and each line extends to that unit’s last observed age. For example, unit 409 was last observed at 389 days and had three valve replacements.