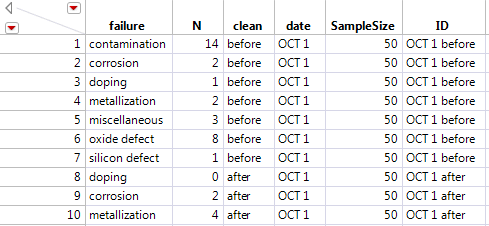
The Failure3MultipleField.jmp sample data table has a row for each unit and multiple columns for defects, where defects are entered one per column. In this example, there are three columns for defects. Thus, any one unit had at most three defects.
|
1.
|
|
2.
|
|
3.
|
|
4.
|
On the Multiple tab, click Multiple Response.
|
|
5.
|
|
6.
|
Click OK.
|
The Failure3ID.jmp sample data table has a row for each defect type within each batch, a column for the number of each defect type, and an ID column for each batch.
|
1.
|
|
2.
|
|
3.
|
Select failure and click Multiple Response by ID on the Multiple tab.
|
|
4.
|
|
5.
|
|
6.
|
|
7.
|
|
8.
|
Click OK.
|
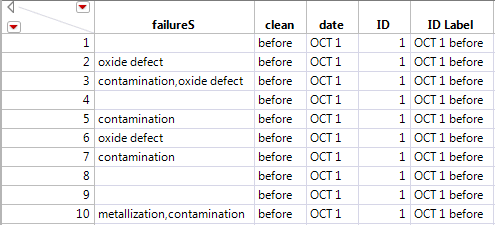
The Failures3Delimited.jmp sample data table has a row for each unit with a single column in which the defects are recorded, delimited by a comma. Note in the partial data table, shown in Failure3Delimited.jmp Data Table (Partial Table), that some units did not have any observed defects, so the failureS column is empty.
|
1.
|
|
2.
|
|
3.
|
|
4.
|
|
5.
|
Click OK.
|
Note: If more than one delimited column is specified, separate analyses are produced for each column.
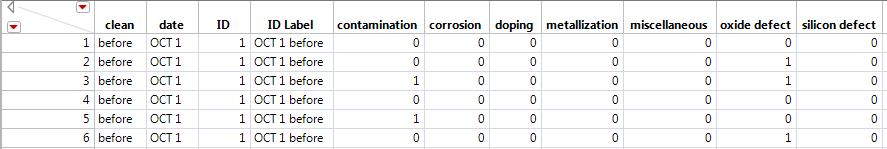
The Failures3Indicators.jmp sample data table has a row for each unit and indicator columns for each defect type. The data entry in each defect columns is a 0 if that defect was not observed and a 1 if the defect was observed for the unit.
|
1.
|
|
2.
|
|
3.
|
Select contamination, corrosion, doping, metallization, miscellaneous, oxide defect, and silicon defect and click Indicator Group on the Multiple tab.
|
|
4.
|
|
5.
|
Click OK.
|
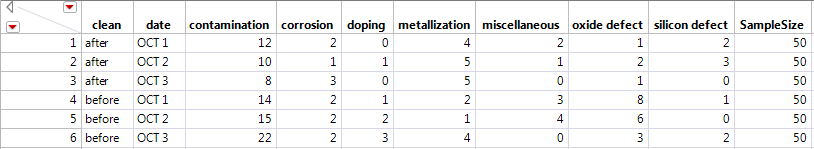
The Failure3Freq.jmp sample data table has a row for each batch, columns for each defect type, and a column for the batch size. The data entries in the defect columns are the frequency of occurrence of the defect in the batch.
|
1.
|
|
2.
|
|
3.
|
Select the frequency variables (contamination, corrosion, doping, metallization, miscellaneous, oxide defect, silicon defect).
|
|
4.
|
On the Multiple tab, click Response Frequencies.
|
|
5.
|
|
6.
|
|
7.
|
Click OK.
|
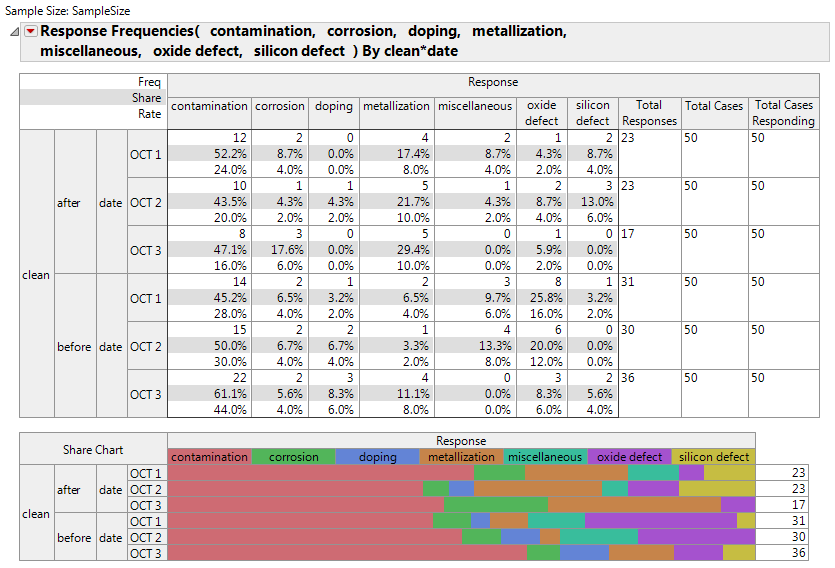
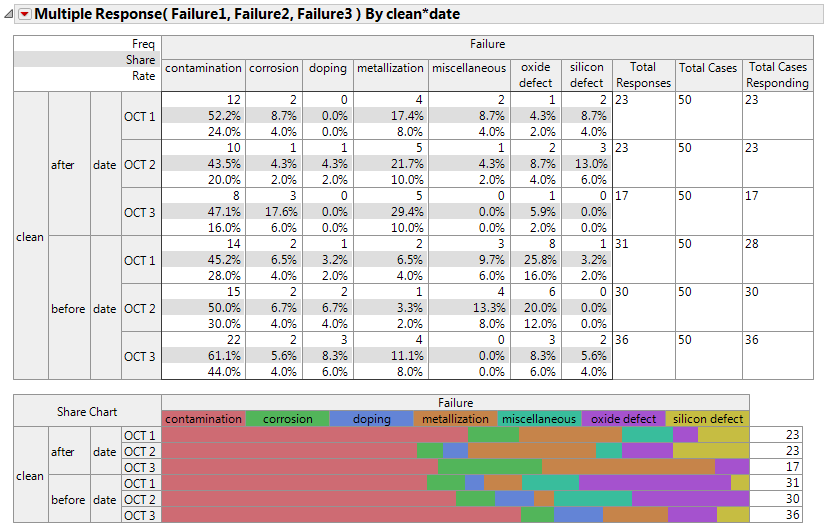
The resulting output is the same as that in Multiple Response Report with the exception of the Total Cases Responding column in the Crosstab table. Here, the defect data was summarized. From the summarized table, there is no record of the number of units with zero defects. Thus, the Total Cases Responding is the full batch size of 50 for each batch.