When you have large effects, the associated p-values are often very small. Visualizing these small values graphically can be challenging. When transformed to the LogWorth (-log10(p-value)) scale, highly significant p-values have large LogWorths and nonsignificant p-values have low LogWorths. A LogWorth of zero corresponds to a nonsignificant p-value of 1. Any LogWorth above 2 corresponds to a p-value below 0.01.
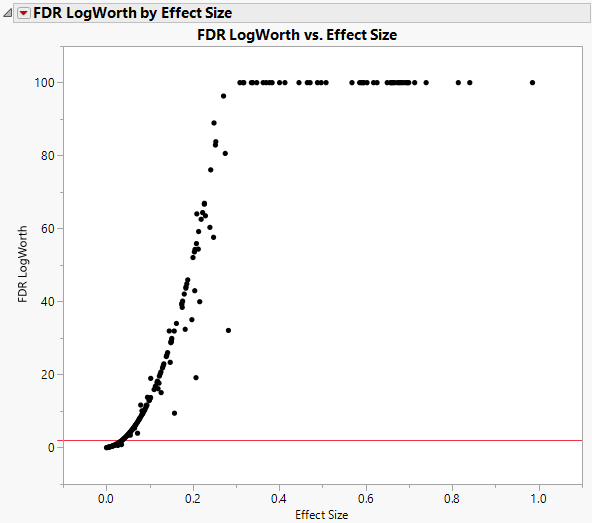
In the FDR LogWorth by Effect Size plot, the vertical axis is the FDR LogWorth and the horizontal axis is the Effect Size. Generally, larger effects lead to more significant p-values and larger LogWorths. However, this relationship is not necessarily strong because significance also depends on the error variance. In fact, large LogWorths can be associated with small effects, and small LogWorths can be associated with large effects, because of the size of the error variance. The FDR LogWorth by Effect Size plot enables you to explore this relationship.
FDR LogWorth by Effect Size shows the FDR LogWorth by Effect size plot for the Probe.jmp sample data table with MaxLogWorth set to 100. Most FDR LogWorth values exceed 2, which indicates that most effects are significant at the 0.01 level. The FDR LogWorth values of 100 correspond to extremely small p-values.