To interpret a two-sided CUSUM chart, compare the points with limits that compose a V-mask. A V-mask is a shape in the form of a V on its side that is superimposed on the graph of the cumulative sums. The V-mask is formed by plotting V-shaped limits. The origin of a V-mask is the most recently plotted point, and the arms extended backward on the x-axis, as in V-Mask for a Two-Sided CUSUM Chart. As data are collected, the cumulative sum sequence is updated and the origin is relocated at the newest point.
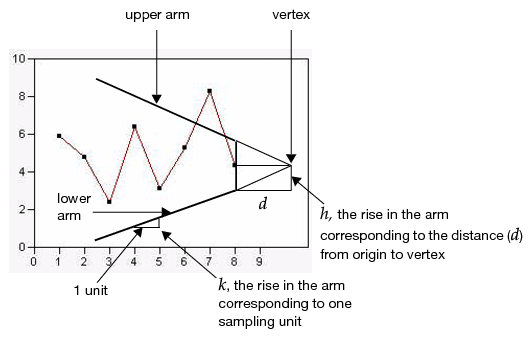
Shifts in the process mean are visually easy to detect on a CUSUM chart because they produce a change in the slope of the plotted points. The point where the slope changes is the point where the shift occurs. A condition is out-of-control if one or more of the points previously plotted crosses the upper or lower arm of the V-mask. Points crossing the lower arm signal an increasing process mean, and points crossing the upper arm signal a downward shift.
|
•
|
The control limits on a Shewhart control chart are commonly specified as 3σ limits. On a CUSUM chart, the limits are determined from average run length, from error probabilities, or from an economic design.
|
A CUSUM chart is more efficient for detecting small shifts in the process mean. Lucas (1976) says that a V-mask detects a 1σ shift about four times as fast as a Shewhart control chart.