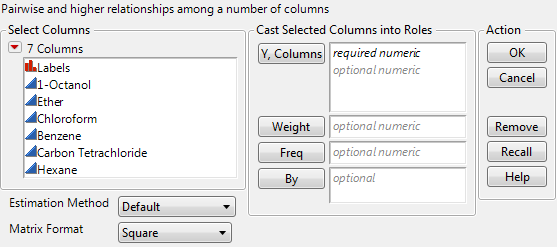
Launch the Multivariate platform by selecting Analyze > Multivariate Methods > Multivariate.
Specifies the method for calculating the correlations. REML and Pairwise are the methods used most frequently. Several of these methods address the treatment of missing data. You can also estimate missing values by using the estimated covariance matrix, and then using the Impute Missing Data command. See Impute Missing Data.
The Default option uses either the Row-wise, Pairwise, or REML methods.
|
–
|
Row-wise estimation is used for data tables with no missing values.
|
|
–
|
Pairwise estimation is used for data tables with missing values and either more than 10 columns, more than 5,000 rows, or more columns than rows.
|
|
–
|
REML estimation is used otherwise.
|
Restricted maximum likelihood (REML) estimation uses all of the data, even if missing values are present. Due to a bias-correction factor, this method is slow if the dataset is large and there are many missing values. Therefore, REML is most useful for smaller datasets. If there are no missing cells in the data, then the REML and ML estimates are equivalent and equal to the sample covariance matrix. If there are missing cells, REML’s variance and covariance estimates are less biased than the estimates from ML estimation. For more information, see REML.
Robust estimation uses all of the data, even if missing values are present. This method down-weights extreme values and is therefore useful for data tables that might have outliers. For statistical details, see Robust.
Select a format option for the Scatterplot Matrix. The Square option displays plots for all ordered combinations of columns. Lower Triangular displays plots below the diagonal, with the first n - 1 columns on the horizontal axis. Upper Triangular displays plots above the diagonal, with the first n - 1 columns on the vertical axis.