Launch Ternary Plot by selecting Graph > Ternary Plot.
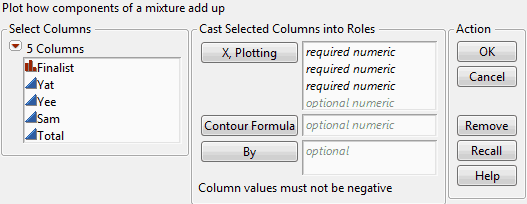
If you assign more than 3 variables to the X, Plotting role, a matrix of ternary plots is created. A separate variable is assigned to the first two axes of a plot, with the third axis being the sum of the other variables. If necessary, the variables are scaled so they sum to 1.
To plot contours of a response surface, assign a column containing a formula to the Contour Formula role. If you have variables in a Contour formula that are not listed as X, Plotting variables, JMP appends sliders below the plot so that the values can be interactively adjusted. See Example Using a Contour Function.