You can also specify a limits data table with the Load spec limits from data table option from the Spec Limits window. Click the Select Data Table button and then select the appropriate data table that contains the specification limits for the analysis. After you select the appropriate limits table, the values populate the window. Click OK to view the Process Capability report.
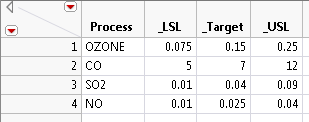
A limits data table can be in two different formats: tall or wide. A tall limits data table has one column for the responses and the limits key words are the other columns. A wide limits data table has a column for each response with one column to label the limits keys. Either of these formats can be read using the Load spec limits from data table option.
|
•
|
|
•
|
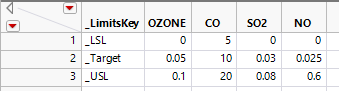
A wide table contains three rows and one column for each column analyzed in the Process Capability platform plus a _LimitsKey column. In the _LimitsKey column, the three rows need to contain the identifiers _LSL, _USL, and _Target.
|
|
•
|
Select Save Spec Limits as Column Properties to save the limits to the columns in the data table.
|
|
•
|
Select Save Spec Limits to New Table to save the limits to a new tall specification limits data table. If you have selected at least one nonnormal distribution, a column called Distribution that contains the specified distributions is also added to the limits data table.
|