The Line element  uses line segments to connect summary statistic values (or raw values) of the variable plotted on the Response Axis across the values or categories of another variable.
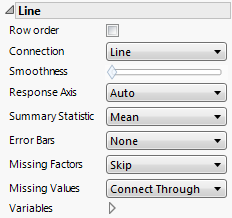
Note: These options do not apply to variables in the Overlay, Group X, Group Y, Wrap, or Page zones.
Tip: If you have multiple graphs, you can color or size each graph by different variables. Drag a second variable to the Color or Size zone, and drop it in a corner. In the Variables option, select the specific color or size variable to apply to each graph.