Click Make Table to create a data table that contains the runs for your experiment. In the table, the high and low values that you specified appear for each run.
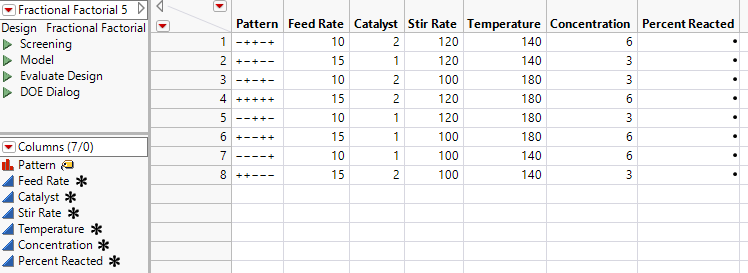
If the design was selected from the Design List, the design table contains a Pattern column. The Pattern column contains entries that summarize the run in the given row. Low settings are denoted by “–”, high settings by “+”, and center points by “0”. Pattern can be useful as a label variable in plots.