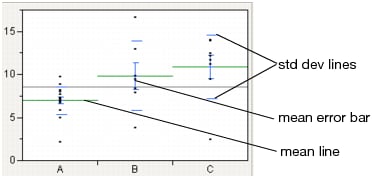
Show mean lines by selecting Display Options > Mean Lines. Mean lines indicate the mean of the response for each level of the X variable.
Mean error bars and standard deviation lines appear when you select the Means and Std Dev option from the red triangle menu. See Mean Lines, Mean Error Bars, and Std Dev Lines. To turn each option on or off singly, select Display Options > Mean Error Bars or Std Dev Lines.