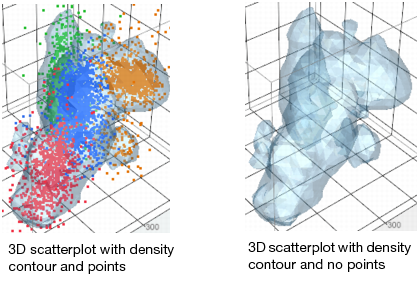
This feature is particularly valuable when you have many points on a 3D scatterplot; the contours can be so dark that you cannot see the structure. In this situation, you remove the points so that only the contours are displayed. See Optimizing a Dense Nonparametric Density Contour for details.
You display and remove nonparametric density contours by selecting and deselecting Nonpar Density Contours from the red triangle menu.
|
–
|
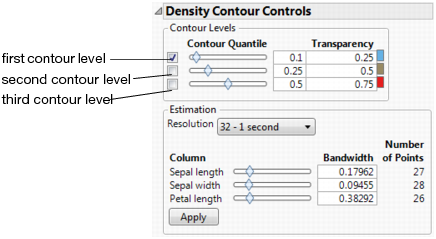
Density level represents the volume and density of the points. As the contours go from smaller to larger values, the contours cover less volume but more dense areas. A 0.9 contour represents the 10% densest part of the total, where the points are closest together. Click and drag the slider below “Contour Quantile,” or enter a value next to the slider.
|
|
–
|
Transparency changes the surface of density contours. The greater the value, the more opaque the contour. Enter a value in the box.
|
|
–
|
Color changes the color of the contour. Click the colored box and select a different color. (This option only appears for ungrouped density contours.)
|
Type a new bandwidth for each variable, or click and drag the sliders. Click Apply to display your changes.
To remove points from a 3D scatterplot, select Show Points from the red triangle menu. You can further optimize the contours by changing their size, color, and transparency. See Scatterplot 3D Platform Options for details.