The file BrakeReliability.jmp, found in the Reliability subfolder, contains data on fixes to a braking system. The Date column gives the dates when Fixes, given in the second column, were implemented. For this data, the failure times are known. Note that the Date column must be in ascending order.
The test start time is the first entry in the Date column, 09/29/2011, and the corresponding value for Fixes is set at 0. This is needed in order to convey the start time for testing. Had there been a nonzero value for Fixes in this first row, the corresponding date would have been treated as the test start time, but the value of Fixes would have been treated as 0 in the analysis.
The test termination time is given in the last row as 05/31/2012. Because the value in Fixes in the last row is 0, the test is considered to be time terminated on 5/31/2012. Had there been a nonzero value for Fixes in this last row, the test would have been considered failure terminated.
|
1.
|
|
2.
|
Select Analyze > Reliability and Survival > Reliability Growth.
|
|
3.
|
Select the Dates Format tab.
|
|
4.
|
|
5.
|
|
6.
|
Click OK.
|
|
7.
|
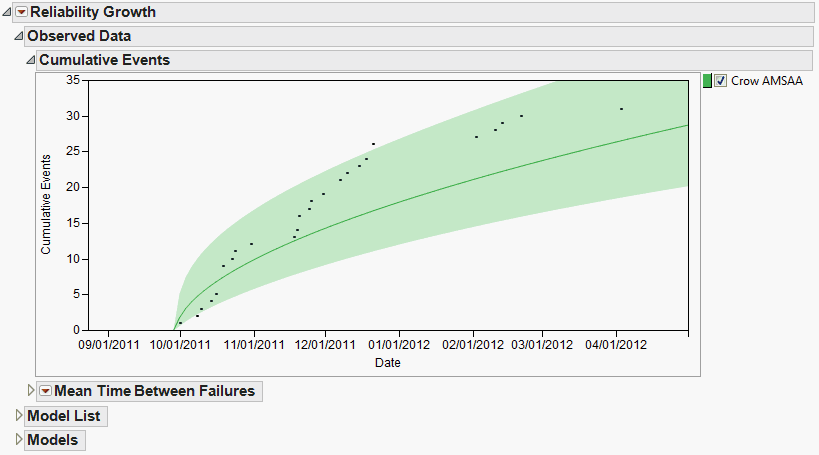
From the red triangle menu at Reliability Growth, select Fit Model > Crow AMSAA.
|
The Cumulative Events plot in the Observed Data report updates to show the model (Cumulative Events Plot with Crow AMSAA Model). The model does not seem to fit the data very well.
|
8.
|
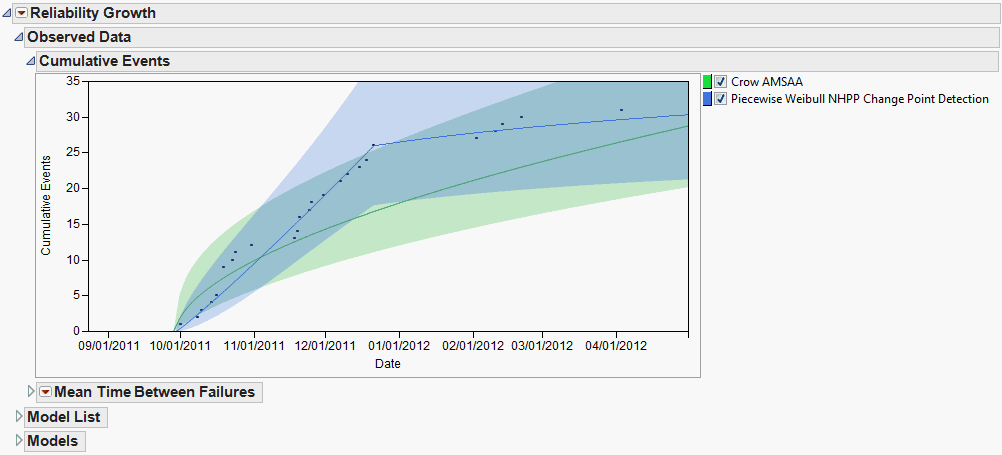
From the red triangle menu at Reliability Growth, select Fit Model > Piecewise Weibull NHPP Change Point Detection.
|
The Cumulative Events plot in the Observed Data report updates to show the piecewise model fit using change-point detection. Both models are shown in Cumulative Events Plot with Two Models. Though the data are rather sparse, the piecewise model seems to provide a better fit to the data.