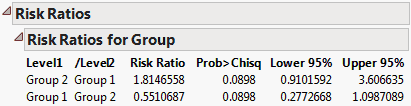
To show risk ratios for effects, select the Risk Ratios option from the red triangle menu. In this example, there is only one effect, and there are only two levels for that effect. The risk ratio for Group 2 is compared with Group 1 and appears in the Risk Ratios for Group report. See Risk Ratios for Group Table. The risk ratio in this table is determined by computing the exponential of the parameter estimate for Group 2 and dividing it by the exponential of the parameter estimate for Group 1.
|
•
|
Tip: To see the Reciprocal values, right-click in the Risk Ratios report and select Columns > Reciprocal.