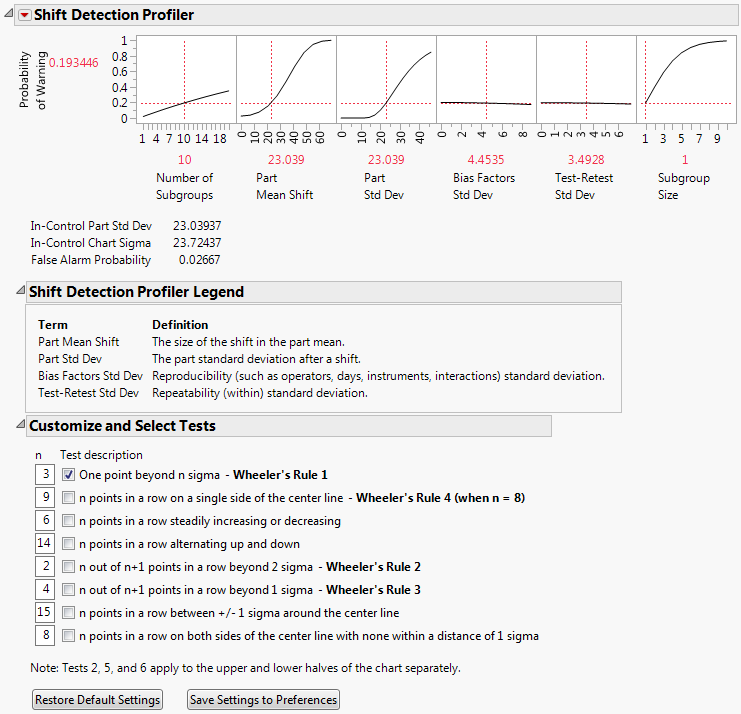
Shift Detection Profiler for Gasket.jmp shows the Shift Detection Profiler report for the Gasket.jmp sample data table, found in the Variability Data folder.
Often, parts for an MSA study are chosen to have specific properties and do not necessarily reflect the part-to-part variation seen in production. For this reason, you can specify the in-control part standard deviation by selecting Change In-Control Part Std Dev from the Shift Detection Profiler red triangle menu.
For a subgroup of size n, control limits are set at the following values:
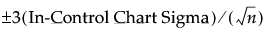

 to account for the assumption that the reproducibility factors are constant within a subgroup.
For more information about the Variance Components report, see Variance Components in Variability Gauge Charts.
The number of subgroups over which the probability of a warning is computed. If the number of subgroups is set to k, the profiler gives the probability that the control chart signals at least one warning based on these k subgroups. The Number of Subgroups is set to 10 by default. Drag the vertical line in the plot to change the Number of Subgroups.
Displays a window for each factor allowing you to enter a specific value for the factor’s current setting, to lock that setting, and to control aspects of the grid. See Set or Lock Factor Values in the Profilers book for details.
{factor1 = n1, factor2 = n2, ...}
ProfileCallbackLog = Function({arg},show(arg));
Then enter ProfileCallbackLog in the Set Script dialog.
ProfileCallbackAssign = Function({arg},evalList(arg));
This panel gives a brief description of four of the Shift Detection Profiler settings. For further details, see Shift Detection Profiler Settings.
Tip: To prevent the legend from appearing, deselect Show Shift Detection Profiler Legend in the EMP Measurement Systems Analysis platform preferences.
In the Customize and Select Tests panel, select and customize the tests that you want to apply to the k subgroups in your control chart. The eight tests are based on Nelson (1984). For more details about the tests, see Tests in Control Chart Builder.
If no settings have been saved to preferences, this option resets the selected tests to the first test only. The values of n are also reset to the values described in Tests in Control Chart Builder. If settings have been saved to preferences, this option resets the selected tests and the values of n to those specified in the preferences.
Note: You can access preferences for control chart tests by selecting File > Preferences> Platforms > Control Chart Builder. Custom Tests 1 through 8 correspond to the eight tests shown in Customize and Select Tests.
Saves the selected tests and the values of n for use in future analyses. These preferences are added to the Control Chart Builder platform preferences.