To set these limits in the data table, highlight a column and select Cols > Column Info. Then, click the Column Properties button and select the Spec Limits property.
After entering the spec limits, they are incorporated into the profilers. Click the Save button if you want the spec limits saved back to the data table as a column property.
With these specification limits, and the distributions shown in Profiler with Simulator, click the Simulate button. Notice the colored spec limit lines in the output histograms. The black dashed lines indicate the mean of the simulations.
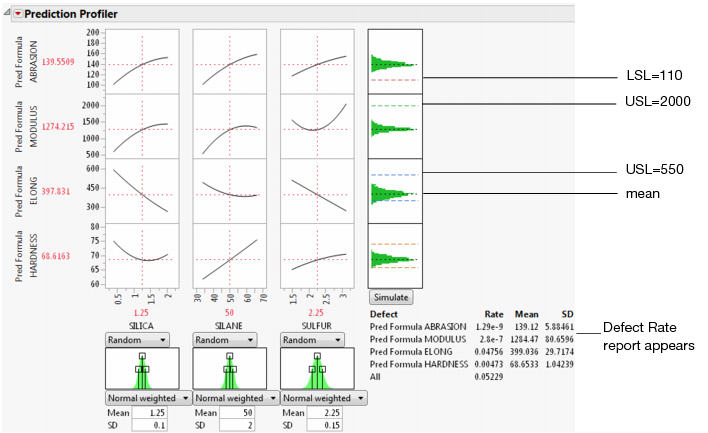
Look at the histogram for Abrasion. The lower spec limit is far below the distribution, yet the Simulator is able to estimate a defect rate for it. This despite only having 5000 runs in the simulation. It can do this rare-event estimation when you use a Normal weighted distribution.
Note that the Overall defect rate (0.05229) is close to the defect rate for ELONG (0.04756), indicating that most of the defects are in the ELONG variable.
To see this weighted simulation in action, click the Make Table button and examine the Weight column.