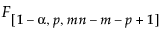
Consider the case where p variables are monitored and m subgroups of size n > 1 are obtained. A T2 statistic is calculated and plotted for each subgroup. The calculation of the T2 statistic and upper control limit (UCL) depends on the source of the target statistics. In a Phase I chart, the limits are based on the same data that is being plotted on the control chart. In a Phase II chart, the limits are based on target statistics that were calculated from a historical data set. For more information about T2 statistic and control limit calculations for Hotelling T2 control charts, see Montgomery (2013).
 is the mean of the subgroup means
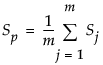 is the pooled covariance matrix, calculated as the mean of the within-subgroup covariance matrices
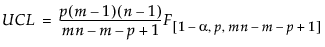
p = number of variables
n = sample size for each subgroup
m = number of subgroups
 = (1–
= (1–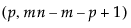
In Phase II control charts, define the historical data set from which the target statistics are calculated as X. Then the T2 statistic for the jth subgroup is defined as follows:
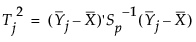
Xk is the mean of the n column vectors of p measurements for the kth subgroup from the historical data set
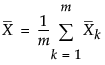 is the overall mean of the observations
Sk is the sample covariance matrix for the n observations in the kth subgroup from the historical data set
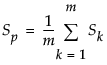 is the pooled covariance matrix, calculated as the mean of the within-subgroup covariance matrices
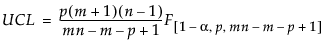
p = number of variables
n = subgroup sample size
m = number of subgroups in the historical data set
 = (1–
= (1–
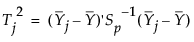
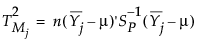
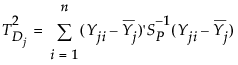
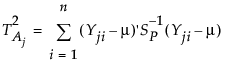
When a sample of mn independent normal observations is grouped into m rational subgroups each of size n, define T2M as the distance between the mean Yj of the jth subgroup and the target value. (T2M is equivalent to T2 in the previous sections for observations in rational subgroups.) You can also calculate T2 statistics related to the internal variability in each subgroup and the overall variability around the target value. The components of the T2 statistic are additive, much like sums of squares. Specifically, the following relationship is true for each of the m subgroups:
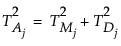
In all of the following definitions, Sp is defined as it is in the previous sections, depending on whether the control chart is a Phase I or a Phase II control chart. Also, define μ as Y for Phase I control charts and as X for Phase II control charts.
Note: When you select the Save T Square or Save T Square Formula options from the Multivariate Control Chart red triangle menu, the three values saved in each row correspond to one value of i in the three definitions above.