Subset() creates a new data table from rows that you specify. If you specify no rows, Subset uses the selected rows. If no rows are selected or specified, it uses all rows. If no columns are selected or specified, it uses all columns. And if Subset has no arguments, the Subset window appears.
dt << Subset(
Columns( columns ),
Rows( row matrix ),
Linked,
Output Table Name( "name" ),
Copy Formula( 1 or 0 ),
Sampling rate( n ),
Suppress Formula Evaluation( 1 or 0 ) );
For example, using Big Class.jmp, to select the columns for all rows in which the age is 12:
dt = Open( "$SAMPLE_DATA/Big Class.jmp" );
For Each Row( Selected( Row State() ) = (:age == 12) );
subdt = dt << Subset( Output Table Name( "Subset" ) );
dt = Open( "$SAMPLE_DATA/Big Class.jmp" );
subDt1 = dt << Subset(
Columns( :name, :age, :height ),
Output Table Name( "Big Class 2" )
);
dt = Open( "$SAMPLE_DATA/Big Class.jmp" );
subDt2 = dt << Subset(
Columns( :name, :weight ),
Rows( [2, 4, 6, 8] ),
Linked
);
dt = Open( "$SAMPLE_DATA/Big Class.jmp" );
dt << Select Where( :age == 12 );
dt << Subset( ( Selected Rows ), Output Table Name( "Subset" ) );
dt << Data Filter( <local>, <invisible>, <Add Filter (...)>, <Mode>, <Show Window( 0 | 1 ), <No Outline Box( 0 | 1 )> );
Options for Data Filter include the following:
Add Filter, Animation, Auto Clear, Clear, Close, Columns, Conditional, Data Table Window, Delete, Delete All, Display, Get Filtered Rows, Location, Match, Mode, Report, Save and Restore Current Row States, Set Select, Set Show, Set Include, Show Column Selector, Show Subset, Use Floating Window
You can send an empty Data Filter message to a data table, and the initial Data Filter window appears, showing the Add Filter Columns panel that lists all the variables in the data table.
Mode takes three arguments, all of which are optional: Select(bool), Show(bool), Include(bool). These arguments turn on or off the corresponding options. The default value for Select is true (1). The default value for Show and Include is false (0).
Add Filter() adds rows and builds the WHERE clauses that describe a subset of the data table. The basic syntax appears as follows:
Add Filter( Columns( col, ... ), Where( ... ), ... )
dt = Open( "$SAMPLE_DATA/Big Class.jmp" );
df = dt << Data Filter(
Mode( Show( 1 ) ),
Add Filter(
Columns( :age, :sex, :height ),
Where( :age == {13, 14, 15} ),
Where( :sex == "M" ),
Where( :height >= 50 & :height <= 65 )
)
);
This script selects 13, 14, and 15-year-old males with a height greater than or equal to 50 and less than or equal to 65. In this filtered data, you can instead select the excluded ages by adding the Invert Selection message to the preceding script.
df << ( Filter Column( :age ) << Invert Selection );
You can also use Add Filter() to select matching strings from columns with the Multiple Response property or Multiple Response modeling type.
dt = Open( "$SAMPLE_DATA/Consumer Preferences.jmp" );
df = dt << Data Filter(
Location( {437, 194} ),
Add Filter(
Columns( :Brush Delimited ),
Match None( Where( :Brush Delimited == {"Before Sleep", "Wake"} ) ),
Display( :Brush Delimited, Size( 121, 70 ), Check Box Display )
)
);
This script selects rows with values in the Brush Delimited column that do not match either of the specified values ("Before Sleep", "Wake"). Other available scripting options include Match Any, Match All, Match Exactly, and Match Only. See Multiple Response in the Using JMP book for details about the Multiple Response property and the Multiple Response modeling type.
Clear(), Display( ... ), Animate(), Mode(), ...
Clear takes no arguments and clears the data filter.
To prevent the data filter from appearing when the script is run, set Show Window to 0 as follows:
obj = ( dt << Data Filter( Show Window( 0 ) ) );
To specify which values to exclude, use the != operator. The following example excludes ages 16 and 17 from the filtered values.
dt = Open( "$SAMPLE_DATA/Big Class.jmp" );
df = dt << Data Filter(
Add Filter( Columns( :age, :sex ) ),
Match( Columns( :age, :sex ),
Where( :sex = "M" ), Where( :age != {16, 17} )
)
);
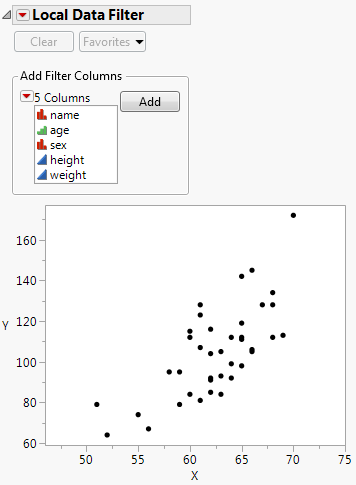
Another option is to filter data from specific platforms or display boxes. Create a local data filter inside the Data Filter Context Box() function. This defines the context as the current platform or display box rather than the data table.
The following example creates a local data filter for a Graph Box. See Local Filter with Two Bubble Plots for the output.
New Window( "Marker Seg Example",
Data Filter Context Box(
V List Box(
dt << Data Filter( Local ),
g = Graph Box(
Frame Size( 300, 240 ),
X Scale( Min( xx ) - 5, Max( xx ) + 5 ),
Y Scale( Min( yy ) - 5, Max( yy ) + 5 ),
Marker Seg( xx, yy, Row States( dt, rows ) )
)
)
)
);
Tip: The preceding script is part of a larger script that first builds the arrays required for a marker seg. To experiment with this script, open the Local Data Filter for Custom Graph.jsl sample script.
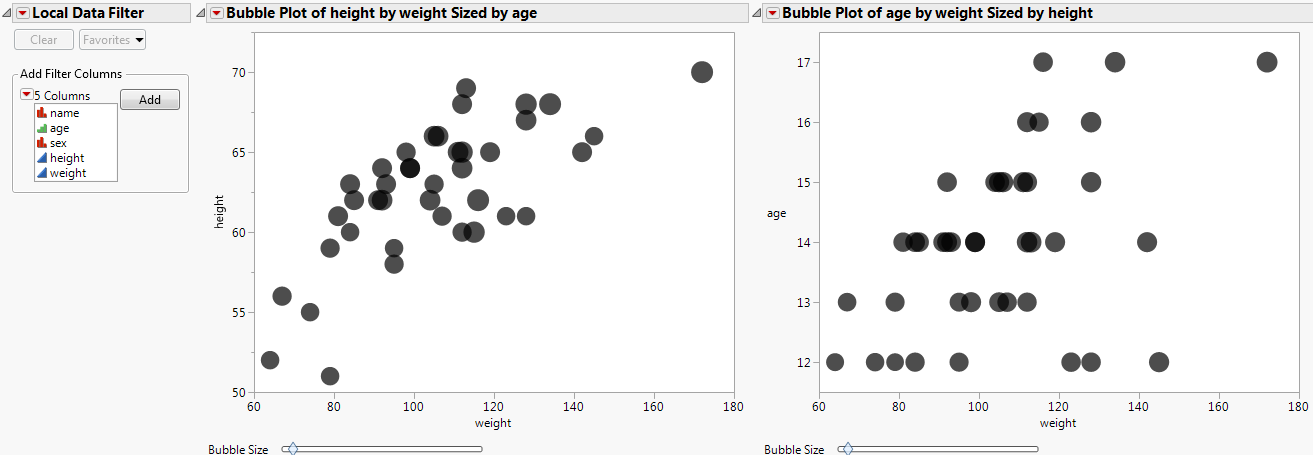
A context box can also contain several graphs with one local filter. The filtering then applies to both graphs. The following script creates two bubble plots and one data filter in one context box. See Local Filter with Two Bubble Plots for the output.
dt = Open( "$SAMPLE_DATA/Big Class.jmp" );
New Window( "Shared Local Filter",
Data Filter Context Box(
H List Box(
dt << Data Filter( Local ),
Platform(
dt,
Bubble Plot( X( :weight ), Y( :height ), Sizes( :age ) )
),
Platform(
dt,
Bubble Plot( X( :weight ), Y( :age ), Sizes( :height ) )
)
)
)
);
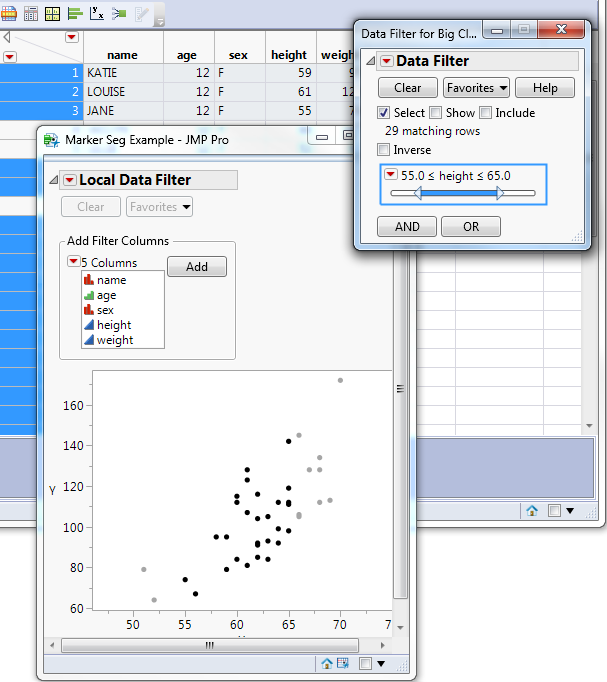
Data filters can be hierarchical. One script might generate a data filter and a local data filter. The outer data filter for the data table determines which data is available for the local data filter. To illustrate this point, the following script produces both types of data filters as shown in Data Filter Hierarchy.
Tip: The following script is part of a larger script that first builds the arrays required for a marker seg. See the Local Data Filter for Custom Graph.jsl sample script for code that builds those arrays.
dt << Data Filter(
Add Filter( Columns( :height ), Where( :height >= 55 & :height <= 65 ) )
);
New Window( "Marker Seg Example",
Data Filter Context Box(
V List Box(
dt << Data Filter( Local ),
g = Graph Box(
Frame Size( 300, 240 ),
X Scale( Min( xx ) - 5, Max( xx ) + 5 ),
Y Scale( Min( yy ) - 5, Max( yy ) + 5 ),
Marker Seg( xx, yy, Row States( dt, rows ) )
)
)
)
);