Note: The number of lags begins with 0 to provide a broader picture of the analysis. To compute correlations beginning with lag 1, modify the JMP preferences before generating the graph. Select File > Preferences > Platforms > Time Series, and then select Suppress Lag 0 in ACF and PACF.
The autocorrelation for the kth lag, computed as follows:
 where
where 
and  is the mean of the N non-missing points in the time series. By definition, the first autocorrelation (lag 0) always has length 1.
is the mean of the N non-missing points in the time series. By definition, the first autocorrelation (lag 0) always has length 1.The bars graphically depict the autocorrelations. The blue curves represent twice the large-lag standard error (± 2 standard errors), computed as follows:

Used to test whether a group of autocorrelations is significantly different from zero, or to test that the residuals from a model can be distinguished from white noise. Q is the test statistic.
The partial autocorrelation for the kth lag.
The bars graphically depict the partial autocorrelations. The blue lines represent ± 2 standard errors for approximate 95% prediction limits, where the standard error is computed as follows:
 for all k
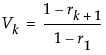
The variogram measures the variance of the differences of points k lags apart and compares it to that for points one lag apart. The variogram is computed from the autocorrelations as follows: