 Uplift Model Graph
Beneath the graph are the control buttons: Split, Prune, and Go. The Go button only appears if there is a validation set. Also shown is the name of the Treatment column and its two levels, called Treatment1 and Treatment2. If more than two levels are specified for the Treatment column, all but the first level are treated as a single level and combined into Treatment2.
The root mean square error (RMSE) for the regression model associated with the tree. RMSE is only given for continuous responses. For more details, see the Fitting Linear Models book.
The Corrected Akaike Information Criterion (AICc), computed using the associated regression model. AICc is only given for continuous responses. For more details, see Likelihood, AICc, and BIC in the Fitting Linear Models book.
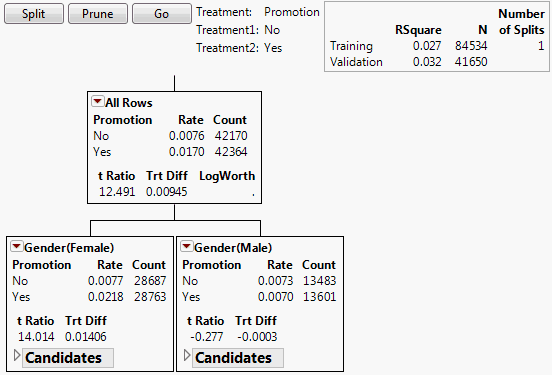
 Uplift Decision Tree
The decision tree shows the splits used to model uplift. See Nodes for First Split for an example using the Hair Care Product.jmp sample data table. Each node contains the following information:
The t ratio for the test for a difference in response across the levels of Treatment for subjects in this node. If the response is categorical, it is treated as continuous (values 0 and 1) for this test.
The maximum logworth over all possible splits for the given term. The logworth corresponding to a split is -log10 of the adjusted p-value.
When the response is continuous, this is the coefficient of the interaction term in the linear regression model used in computing the F ratio. When the response is categorical, this is an estimate of the interaction constructed from Firth-adjusted log-odds ratios.