Note: When you generate a np-chart and select Capability, JMP launches the Binomial Fit in Distribution and gives a Binomial-specific capability analysis.
The following example uses the Washers.jmp data table.
|
•
|
|
•
|
Select Analyze > Quality and Process > Control Chart > NP.
|
|
•
|
|
•
|
Change the Constant Size to 400.
|
|
•
|
Click OK.
|
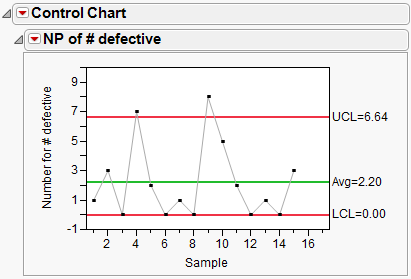
np-chart displays an np-chart for the number of defects. Points 4 and 9 are above the upper control limit.