Note: Analysis columns are numeric, continuous columns for which you want to compute statistics. See Analysis Columns.
Provides the arithmetic mean of a column’s values. It is the sum of nonmissing values (and if defined, multiplied by the weight variable) divided by the Sum Wgt.
|
–
|
To get the percentage of the column total, drag all the grouping columns on the row table and drop them onto the % of Total heading (same as Column %). Similarly, to get the percentage of the row total, drag all grouping columns on the column table and drop them onto the % of Total heading (same as Row %).
|
Provides the sum of all values in the column. This is the default statistic for analysis columns when there are no other statistics for the table.
Provides the sum of all weight values in a column. Or, if no column is assigned the weight role, Sum Wgt is the total number of nonmissing values.
Provides the standard error of the mean. It is the standard deviation divided by the square root of N. If a column is assigned the role of weight, then the denominator is the square root of the sum of the weights.
The nth root of the product of the data. For example, geometric means are often used to calculate interest rates. The statistic is also helpful when the data contains a large value in a skewed distribution.
Note: Negative values result in missing numbers, and zero values (with no negative values) result in zero.
Provides the value at which the specific percentage of the argument is less than or equal to. For example, 75% of the data is less than the 75th quantile. You can request different quantiles by clicking and dragging the Quantiles keyword into the table, and then entering the quantile into the box that appears.
|
1.
|
Click the Change Format button at the bottom of the Tabulate window.
|
|
2.
|
|
4.
|
|
5.
|
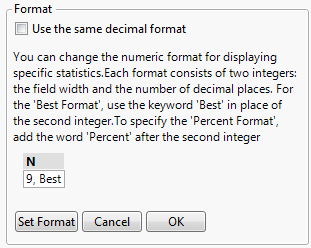
Click OK to implement the changes and close the Format section, or click Set Format to see the changes implemented without closing the Format section.
|
Figure 8.89 Changing Numeric Formats