 Additional Example: SVD Analysis
In this example, you use singular value decomposition of the transaction item matrix to gain further insight into the Grocery Purchases.jmp sample data.
|
1.
|
|
2.
|
Select Analyze > Screening > Association Analysis.
|
|
3.
|
|
4.
|
|
5.
|
Click OK.
|
|
7.
|
Click OK.
|
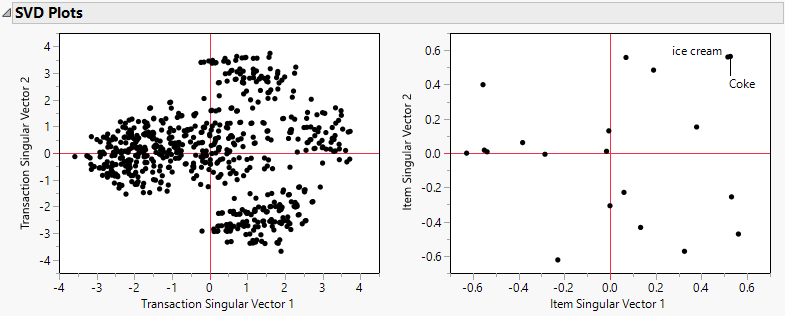
Figure 20.5 SVD Plots
|
8.
|
Click the red triangle next to SVD and select Topic Analysis, Rotated SVD.
|
Figure 20.6 Topic Items Report
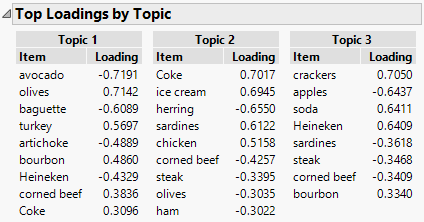
Figure 20.7 Topic Scores
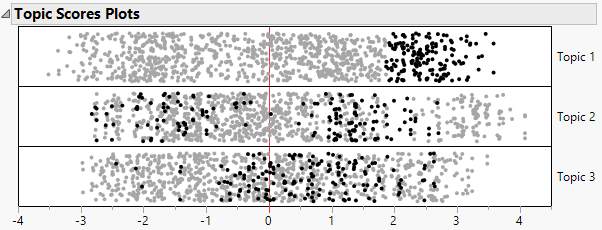
Figure 20.8 Singular Values Table
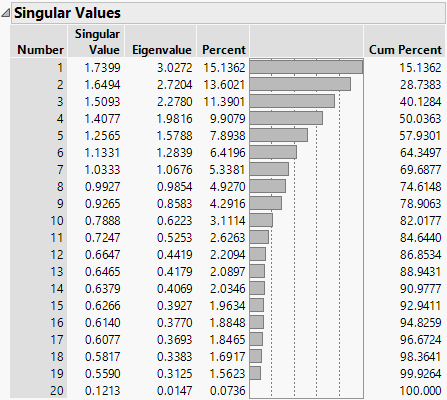
As seen in Figure 20.8, the first two singular values explain only about 30% of the variability in the grocery store data. Additional dimensions might be required to explain a sufficient amount of variability.