Clustering is a multivariate technique that groups observations together that share similar values across a number of variables. Hierarchical clustering combines rows in a hierarchical sequence that is portrayed as a tree. Cereals with certain characteristics, such as high fiber, are grouped in clusters so that you can view similarities among cereals.
Note: For details about hierarchical clustering, see Hierarchical Cluster in the Multivariate Methods book.
|
1.
|
|
2.
|
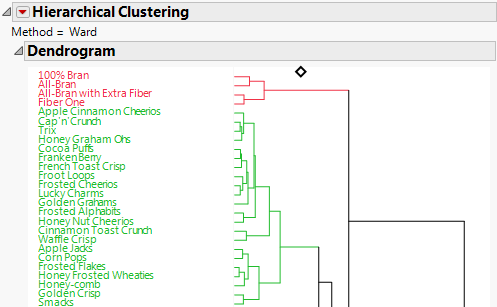
The Hierarchical Clustering report appears. Figure 4.119 shows a portion of the report. The clusters are colored according to the data table row states.
Figure 4.119 Portion of the Hierarchical Clustering Report
|
3.
|
Select Color Clusters from the Hierarchical Clustering red triangle menu.
|
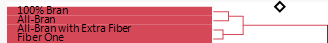
Figure 4.120 Colored Clusters
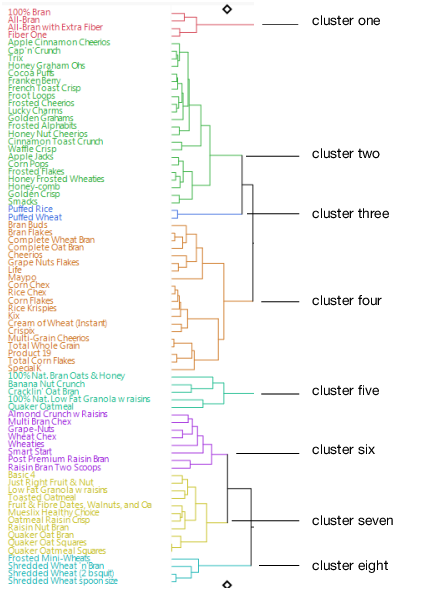
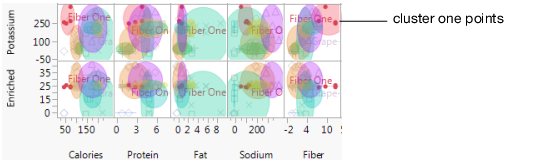
Figure 4.121 Similar Cereals in Cluster One
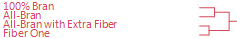
Figure 4.122 Selecting a Cluster
|
5.
|
To see the similar characteristics in the cluster, select Cluster Summary from the red triangle menu.
|
Figure 4.123 Cluster Summary
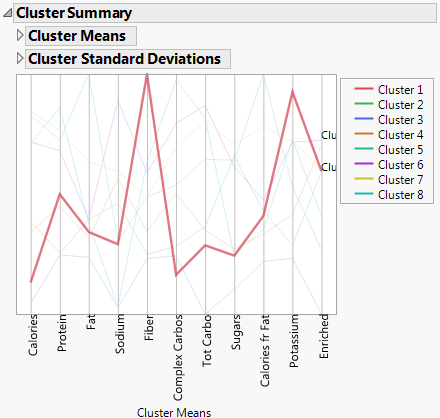
Figure 4.124 Cluster One Characteristics