|
1.
|
The file Bounce Data.jmp contains your experiment results.
|
2.
|
Run the Model script.
|
Notice that the main effects in the Construct Model Effects list are followed by the & RS suffix. This suffix indicates that these are response surface effects, which produce a Response Surface report in the Standard Least Squares report.
|
3.
|
Click Run.
|
Figure 10.6 Lack of Fit and Effect Tests Reports
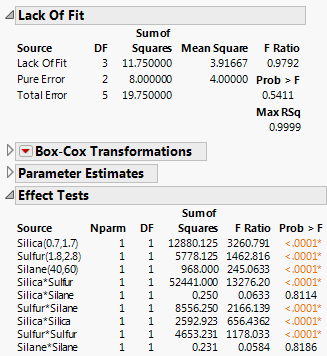
There is no indication of lack of fit and the Effect Tests report indicates that all but two higher-order terms (Silica*Silane and Silane*Silane) have p-values below 0.0001. See Lack of Fit and Effect Tests in the Fitting Linear Models book for more information about interpretation of the tables in Figure 10.6.
Figure 10.7 Response Surface Report
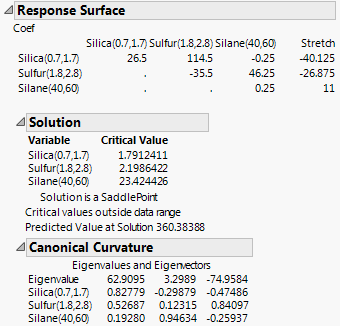
The Coef table shown as the first part of the report gives a concise summary of the estimated model parameters. The first three columns give the coefficients of the second-order terms. The last column gives the coefficients of the linear terms. To see the prediction expression in its entirely, select Estimates > Show Prediction Expression from the Response Stretch red triangle menu.
The Canonical Curvature report shows eigenvalues and eigenvectors of the effects. These give information about the nature and direction of the surface’s curvature. The large positive eigenvalue of 62.9095 indicates positive curvature and the eigenvector values indicate that the curvature is primarily in the Silica direction. The large negative eigenvalue of -74.9584 indicates negative curvature and the eigenvector values indicate that the curvature is primarily in the Sulfur direction.
See Response Surface Model Example in the Fitting Linear Models book for details about the response surface analysis tables in Figure 10.7.