|
1.
|
|
2.
|
Select Analyze > Distribution to open the Distribution launch window.
|
|
3.
|
|
4.
|
Click OK.
|
|
5.
|
From the red triangle menu next to Distributions, select Stack to make your report horizontal.
|
|
6.
|
From the red triangle menu next to Profits ($M), deselect Outlier Box Plot to turn the option off.
|
|
7.
|
|
8.
|
Type 500 in the Specify Hypothesized Mean box.
|
|
9.
|
Click OK.
|
Figure 2.1 Customized Distribution Report
|
10.
|
From the red triangle menu next to Distributions, select Save Script > To Data Table.
|
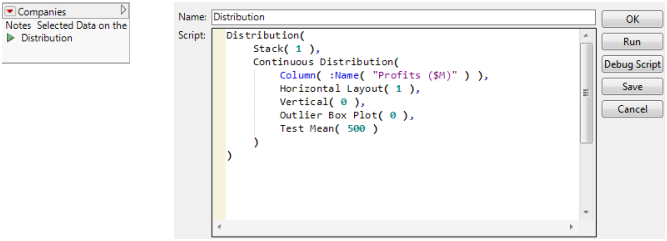
Your data table now has a script named Distribution saved to it. Right-click the Distribution script and select Edit to see the script.
Figure 2.2 Distribution Script Saved to the Data Table