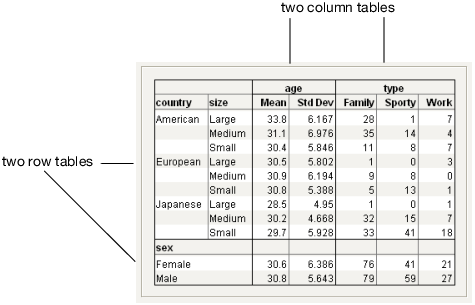
In Tabulate, a table is defined by its column headings and row labels. These sub-tables are referred to as row tables and column tables. See Figure 8.91.
|
1.
|
|
2.
|
Select Analyze > Tabulate.
|
|
3.
|
Drag size into the Drop zone for rows.
|
|
4.
|
|
5.
|
|
6.
|
|
7.
|
|
8.
|
Drag type to the far right of the table.
|
|
9.
|
Drag sex under the table.
|
Figure 8.91 Row and Column Tables