|
1.
|
These are the rows for which species is missing. Hide and exclude these rows.
|
3.
|
Select Rows > Hide and Exclude.
|
|
4.
|
Select Rows > Color or Mark by Column.
|
|
5.
|
Select species.
|
|
6.
|
From the Colors menu, select JMP Dark.
|
|
7.
|
Check Make Window with Legend.
|
|
8.
|
Click OK.
|
|
10.
|
|
11.
|
|
12.
|
Click OK.
|
|
13.
|
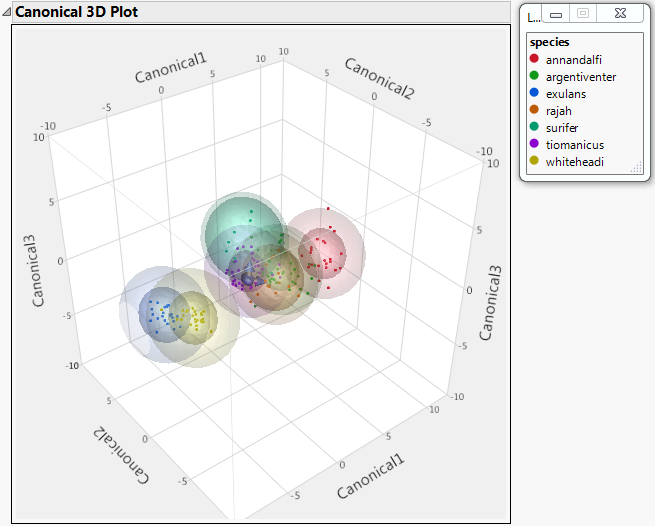
Select Canonical 3D Plot from the Discriminant Analysis red triangle menu.
|
Figure 4.15 Canonical 3D Plot with Legend Window