|
1.
|
|
2.
|
Select Analyze > Specialized Modeling > Gaussian Process.
|
|
3.
|
|
4.
|
|
6.
|
Click OK.
|
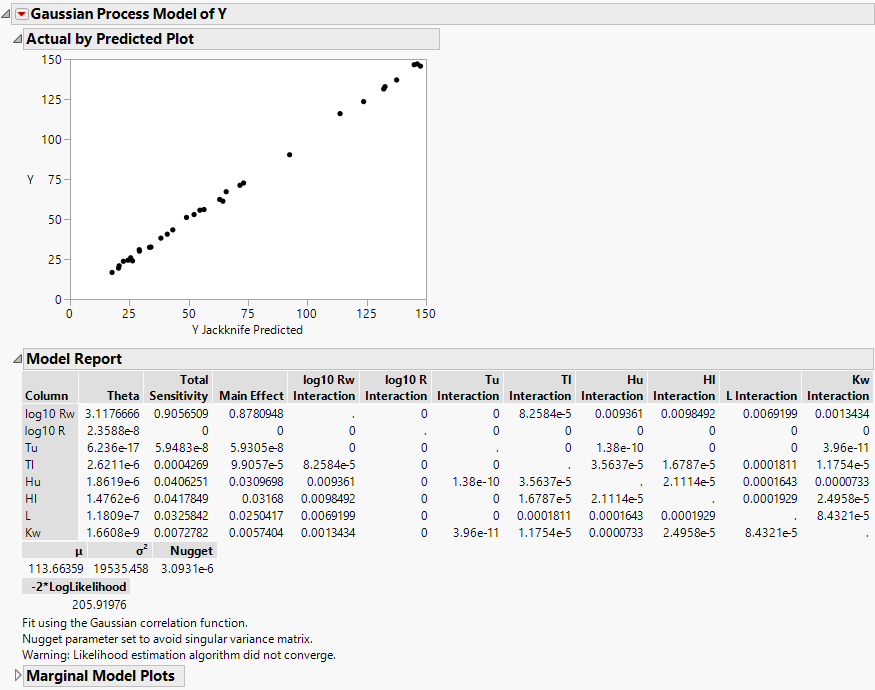
Figure 14.5 Borehole Latin Hypercube Report
Figure 14.6 Gaussian Process Model Profiler
The desirability function is set to maximize the response Y because Y has goal set to Maximize in the Response Limits column property.
Note: Your estimates can differ from those shown in Figure 14.5, which were found using the Fast GASP algorithm.
 In JMP Pro, to run the analysis faster, leave the Fast GASP checked.
