|
1.
|
|
3.
|
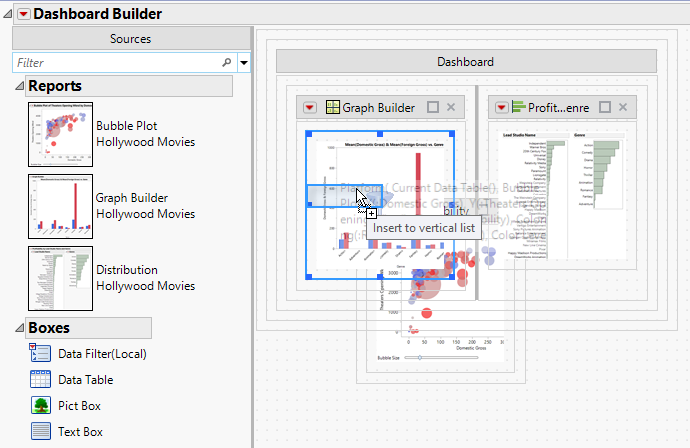
From any window, select File > New > Dashboard.
|
|
4.
|
Select the 2x1 Dashboard template.
|
|
1.
|
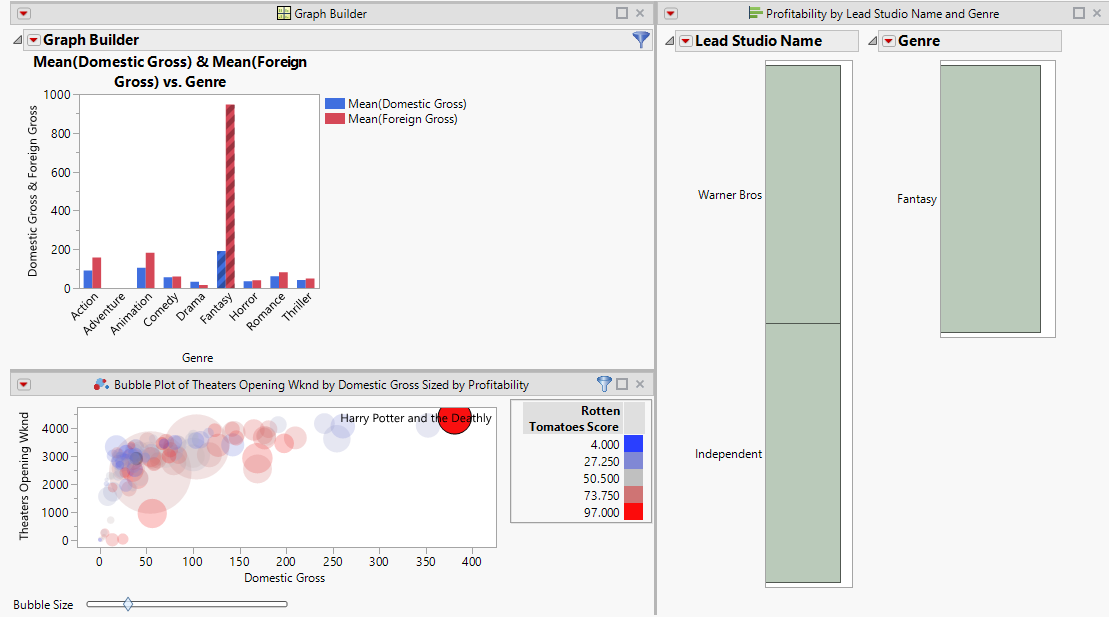
Right-click the center of the left report (Graph Builder) and select Use As Selection Filter.
|
|
3.
|
Select Preview Mode from the Dashboard Builder red triangle menu.
|
Figure 10.14 Filtering Data