
This example uses the Crime.jmp sample data table, which contains data on crime rates for each US state.
|
1.
|
|
2.
|
Select Graph > Graph Builder.
|
|
3.
|
|
4.
|
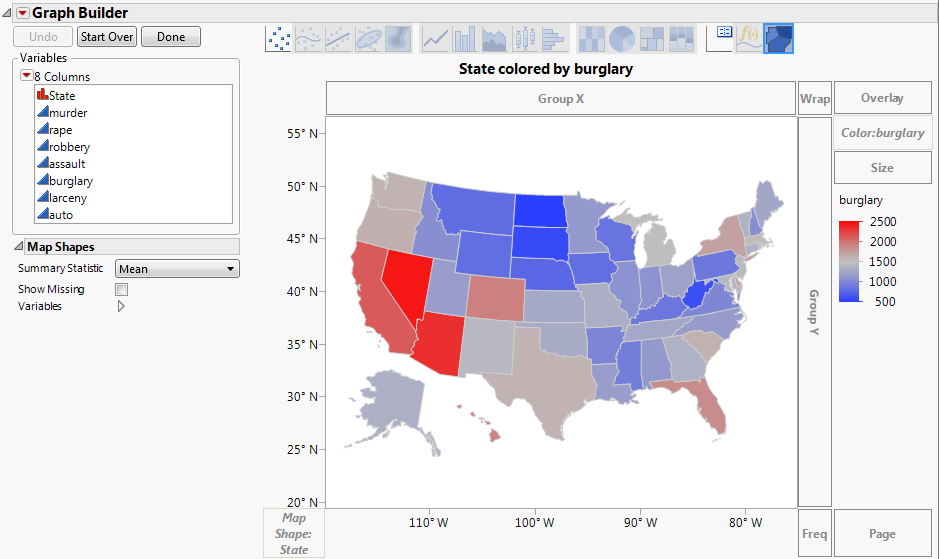
Figure 14.2 Example of Burglary by State
|
•
|
The legend shows the colors that correspond to the burglary rates. Since Burglary is a continuous variable, the colors are based on a continuous color theme. Figure 14.2 uses the JMP default continuous theme. You can change the theme under File > Preferences > Graphs.
|