|
1.
|
|
2.
|
Select Analyze > Consumer Research > Multiple Factor Analysis.
|
|
3.
|
|
4.
|
|
5.
|
Note: The columns in this data table are grouped into one block for each panelist. For ungrouped data, select the columns for a block, click Add Block, and repeat for each block.
|
6.
|
Click Run Model.
|
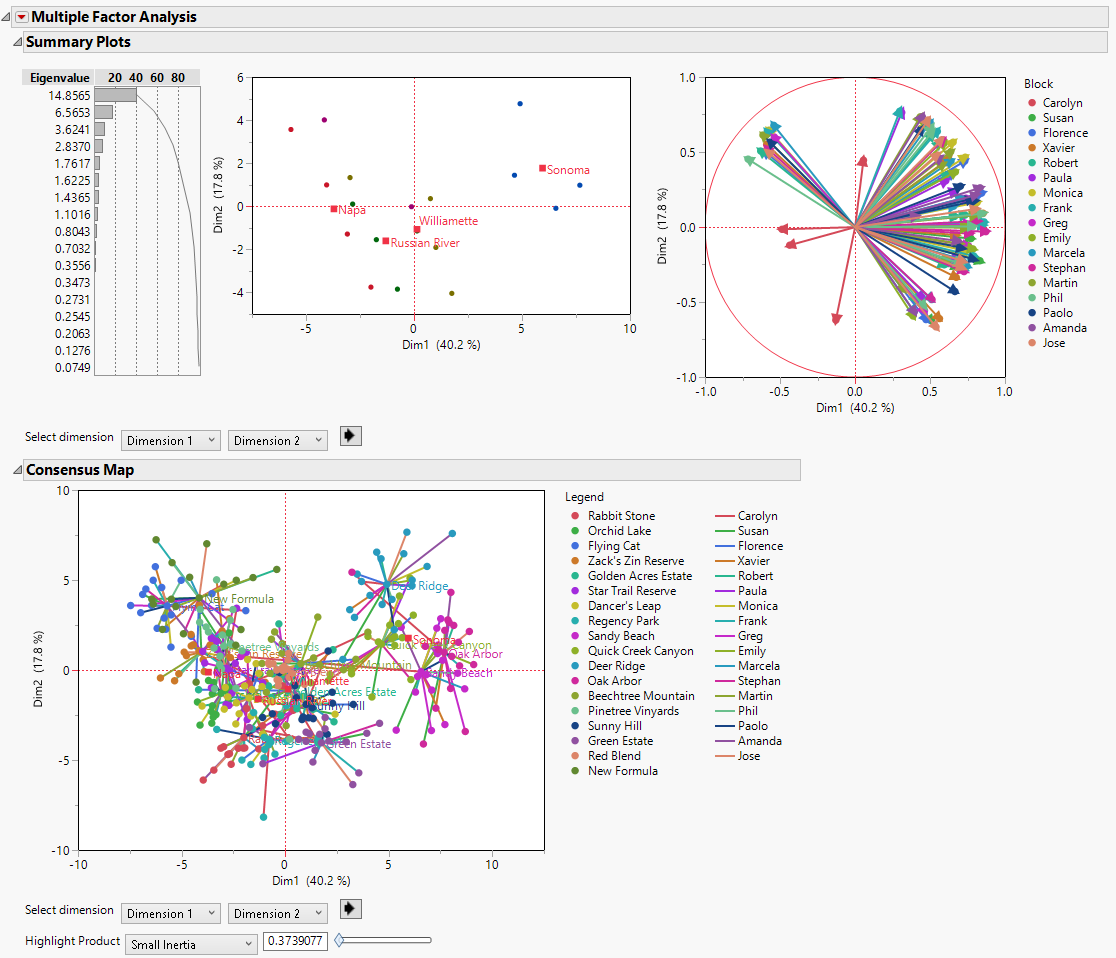
Figure 7.2 Initial Multiple Factor Analysis Report
|
7.
|
In the legend next to the loading plot, click Carolyn to highlight her results.
|
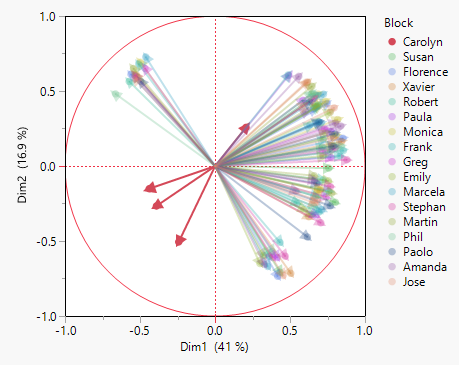
Carolyn’s results differ from the other panelists. You might want to re-run the analysis without her results. See Figure 7.6 for the results of the analysis without Carolyn.