The Bands Data.jmp data table contains measurements from machinery in the rotogravure printing business. The data set contains 539 records and 38 variables. The response Y is the column Banding? and its values are “BAND” and “NOBAND”. You are interested in understanding what properties are most likely to contribute to the response.
|
1.
|
|
2.
|
Select Analyze > Screening > Predictor Screening.
|
|
3.
|
|
4.
|
|
5.
|
Click OK.
|
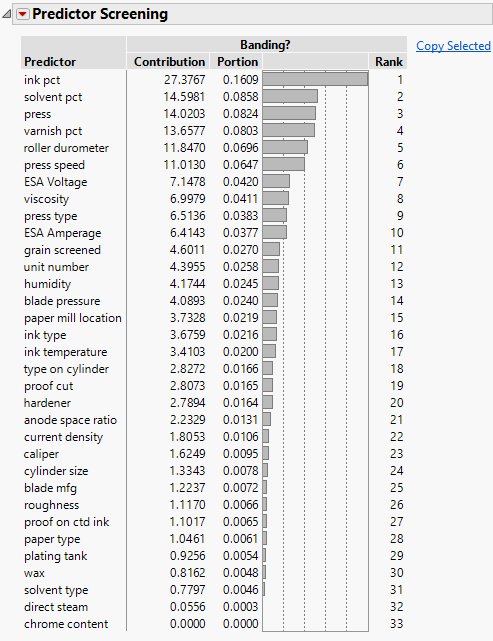
Figure 19.2 Ranked Column Contributions