The following example uses the Coating.jmp sample data table in the Quality Control sample data folder (taken from the ASTM Manual on Presentation of Data and Control Chart Analysis). The quality characteristic of interest is the Weight column. A subgroup sample of four is chosen.
|
1.
|
|
2.
|
Select Analyze > Quality And Process > Control Chart > XBar.
|
|
3.
|
|
4.
|
|
5.
|
Click OK.
|
Figure 3.2 Variables Charts for Coating Data
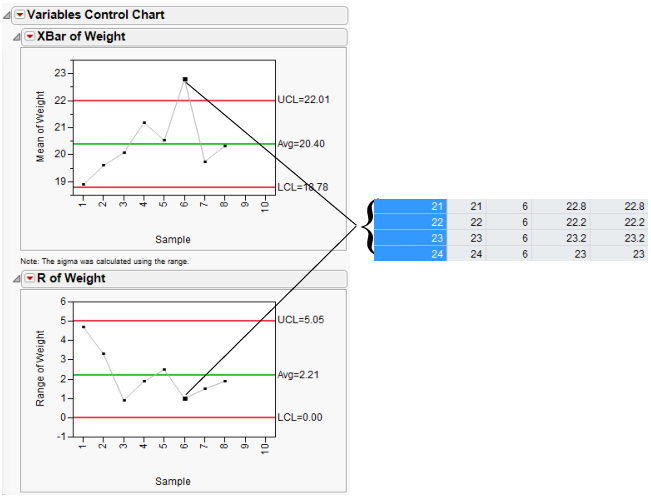
An XBar-chart and an R-chart for the process are shown in Figure 3.2. Sample six indicates that the process is not in statistical control. To check the sample values, click the sample six summary point on either control chart. The corresponding rows highlight in the data table.
Note: If an S chart is chosen with the XBar-chart, then the limits for the XBar-chart are based on the standard deviation. Otherwise, the limits for the XBar-chart are based on the range.