|
1.
|
|
2.
|
Select Analyze > Reliability and Survival > Reliability Forecast.
|
|
3.
|
|
4.
|
|
5.
|
Select the other columns and click Failure Count.
|
|
6.
|
Click OK.
|
Figure 8.2 Observed Data Report
|
7.
|
Click the Life Distribution disclosure icon.
|
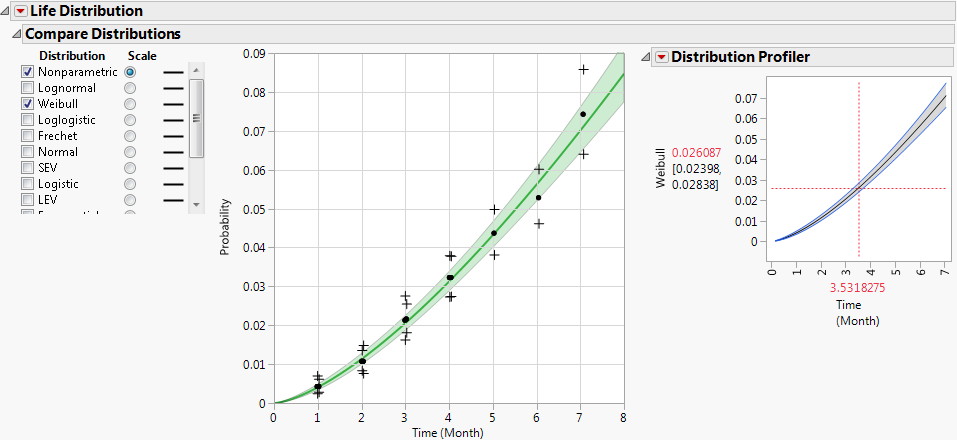
JMP fits production and failure data to a Weibull distribution using the Life Distribution platform. (Figure 8.3). JMP then uses the fitted Weibull distribution to forecast returns for the next five months (Figure 8.4).
Figure 8.3 Life Distribution Report
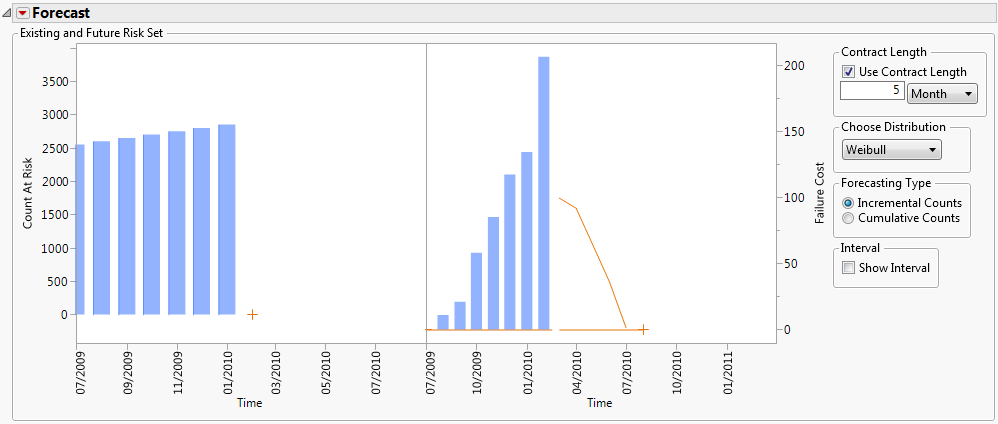
The Forecast report shows previous production on the left graph (Figure 8.4). On the right graph, you see that the number of previous failures increased steadily over time.
Figure 8.4 Forecast Report
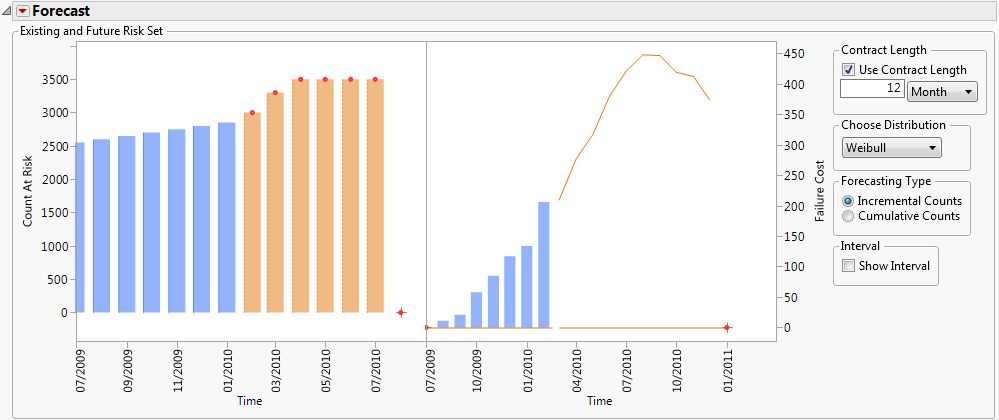
Orange bars appear on the left graph to represent future production. The monthly returned failures in the right graph increase gradually through August 2010 (Figure 8.5).
Figure 8.5 Production and Failure Estimates
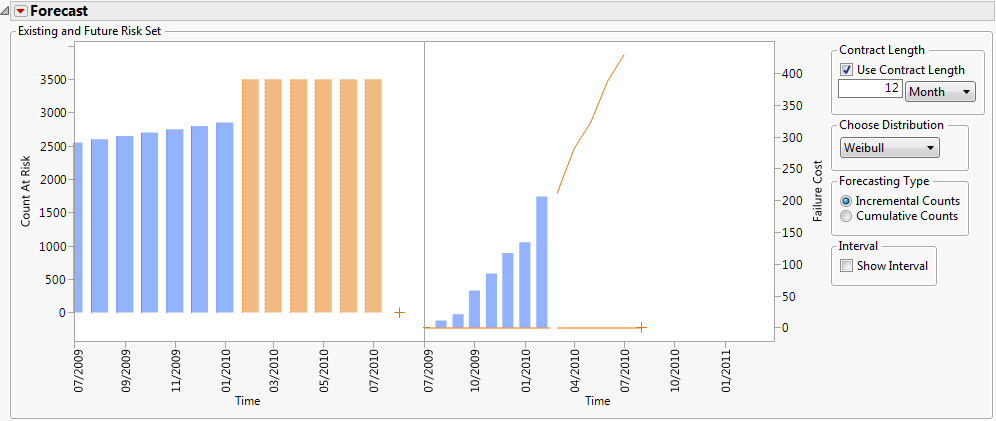
JMP estimates that the number of returns will gradually increase through August 2010 and decrease by February 2011 (Figure 8.6).