Exponential, Weibull, and Lognormal Plots and Fits
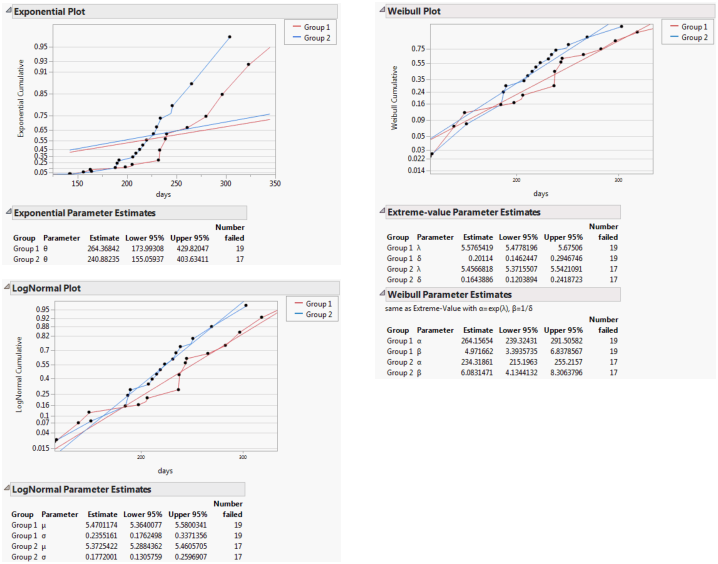
The Weibull distribution is the most popular distribution for modeling time-to-event data. The Weibull distribution can have two or three parameters. The Survival platform fits the two-parameter Weibull distribution. Authors parameterize this distribution in many different ways (as shown in Table 12.2). JMP reports two of these parameterizations: the Weibull alpha-beta parameterization and a parameterization based on the smallest extreme value distribution.
The alpha-beta parameterization, shown in the Weibull Parameter Estimates report, is widely used in the reliability literature (Nelson 1990). The alpha parameter is interpreted as the quantile at which 63.2% of the units fail. The beta parameter determines how the hazard rate changes over time. If beta > 1, the hazard rate increases over time; if beta < 1, the hazard rate decreases over time; and if beta = 1, the hazard rate is constant over time. A Weibull distribution with a constant hazard function is equivalent to an exponential distribution.
The lambda-delta extreme value parameterization is shown in the Extreme-Value Parameter Estimates report. This parameterization is sometimes desirable in a statistical sense because it places the Weibull distribution in a location-scale setting (Meeker and Escobar 1998, p. 86). The location parameter is lambda, and the scale parameter is delta. In relation to the alpha-beta parameterization, lambda is equal to the natural log of alpha, and delta is equal to the reciprocal of beta. Therefore, the delta parameter determines how the hazard rate changes over time. If delta > 1, the hazard rate decreases over time; if delta < 1, the hazard rate increases over time; and if delta = 1, the hazard rate is constant over time. A Weibull distribution with a constant hazard function is equivalent to an exponential distribution.
|
alpha=alpha
|
beta=beta
|
|
|
eta=alpha
|
beta=beta
|
|
|
c = alpha
|
m = beta
|
|
|
eta=alpha
|
beta=beta
|
|
|
exp(X beta)=alpha
|
lambda=beta
|
|
|
beta=alpha
|
alpha=beta
|
|
|
lambda = 1/alpha
|
p = beta
|
|
|
lambda=log(alpha)
|
delta=1/beta
|
|
|
mu=log(alpha)
|
sigma=1/beta
|
The lognormal distribution is also very popular for modeling time-to-event data. The lognormal distribution is equivalent to the distribution where if you take the log of the values, the distribution is normal. If you want to fit a normal distribution to your data, you can take the exp() of it and model your data with a lognormal distribution. See Additional Examples of Fitting Parametric Survival in Fit Parametric Survival.
To see additional options for the exponential, Weibull, and lognormal fits, hold down the Shift key, click the red triangle of the Product-Limit Survival Fit menu, and click on the desired fit.
|
•
|
|
•
|
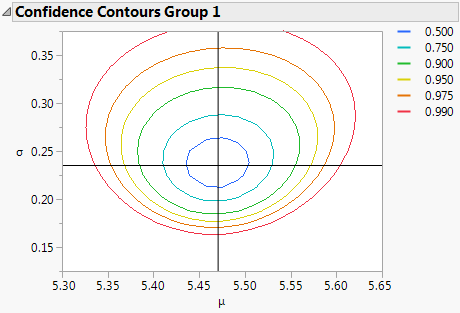
Figure 12.6 Confidence Contour Plot