Figure 8.6 Strong Positive Correlation
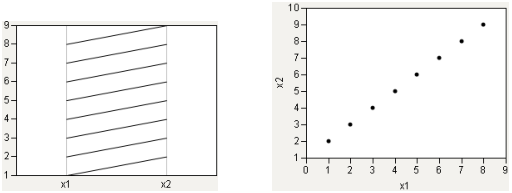
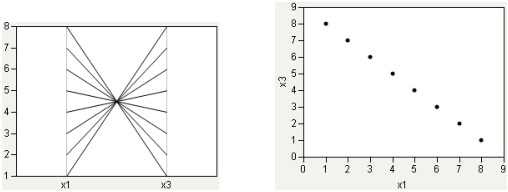
Figure 8.7 Strong Negative Correlation
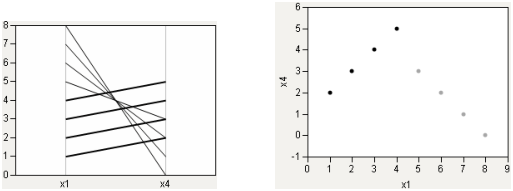
Now, consider a case that encompasses both situations: two groups, both strongly collinear. One has a positive slope, the other has a negative slope. In Figure 8.8, the positively sloped group is highlighted.