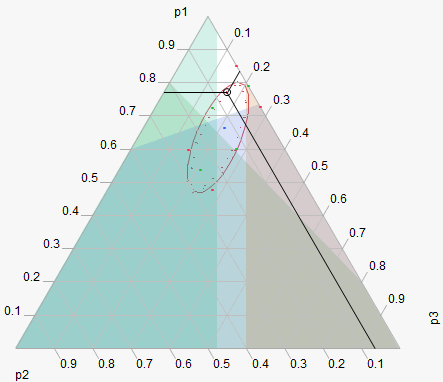
The Mixture Profiler can display linear constraints. To do this, a Constraint Table Script must be part of the data table. For more information about creating the Table Script, see Linear Constraints in Introduction to Profilers.
When using constraints, unfeasible regions are shaded in the profiler. Figure 5.7 shows an example of a mixture profiler with shaded regions due to four constraints. The unshaded portion is the resulting feasible region. The constraints are below:
|
•
|
4*p2 + p3 ≤ 0.8
|
|
•
|
p2 + 1.5*p3 ≤ 0.4
|
|
•
|
p1 + 2*p2 ≥ 0.8
|
|
•
|
p1 + 2*p2 ≤ 0.95
|
Figure 5.7 Shaded Regions Due to Linear Constraints