
Shows the levels of the Y variable corresponding to each cell.
Note: For descriptions of the remainder of the right-click options, see JMP Reports in the Using JMP book.
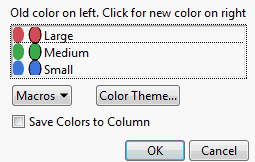
When you select the Set Colors option, the Select Colors for Values window appears.
Figure 6.55 Select Colors for Values Window
|
–
|
The Gradient Between Ends option applies a gradient to all levels of the variable.
|
|
–
|
If you select a range of levels (by dragging the mouse over the levels that you want to select, or pressing the Shift key and clicking the first and last level), the Gradient Between Selected Points option applies a color gradient to the levels that you have selected.
|
|
–
|
Flip the color order by selecting Reverse Colors.
|
|
–
|
Undo any of your changes by selecting Revert to Old Colors.
|
If you select this check box, a new column property (Value Colors) is added to the column in the associated data table. To edit this property from the data table, select Cols > Column Info.